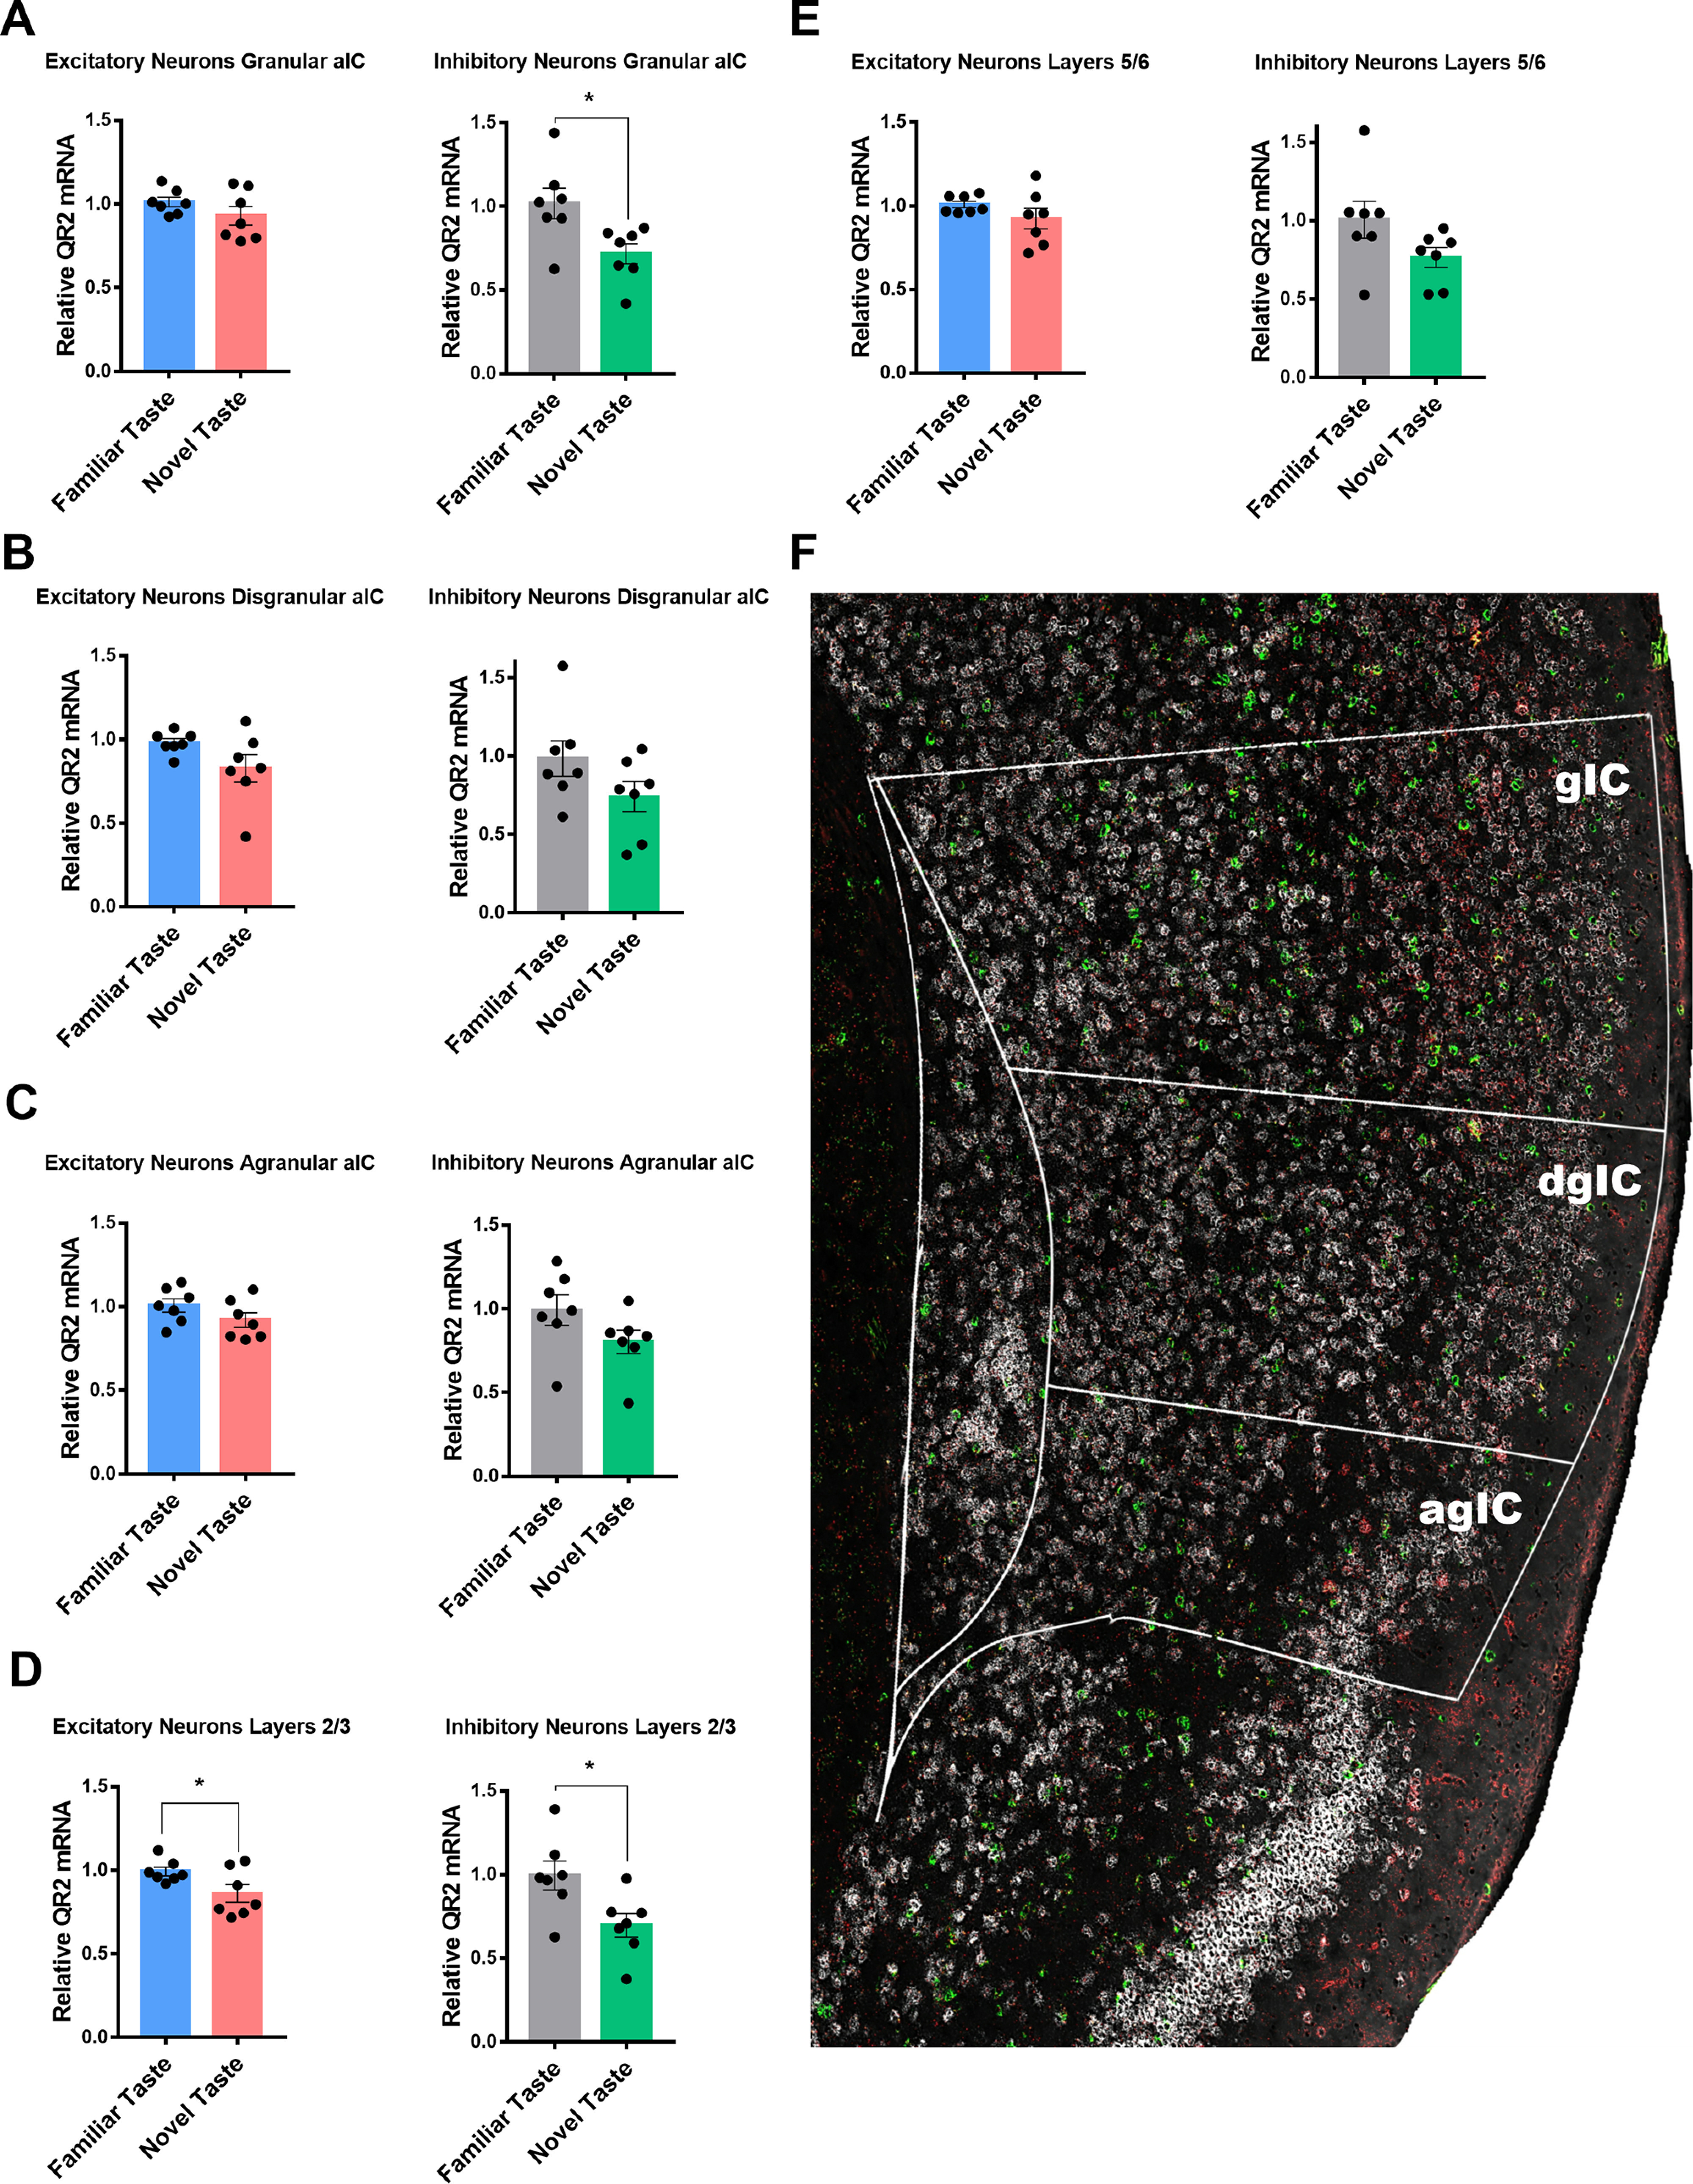
Figure 2.

Reduced QR2 expression across the aIC is significant within inhibitory neurons in the granular subregion and in layers 2/3 within both excitatory and inhibitory neurons following novel taste learning. A, QR2 mRNA FISH-labeled expression levels are not significantly reduced in the gIC in excitatory neurons (familiar taste 1.011 ± 0.028 AU, n = 7; novel taste 0.929 ± 0.055 AU, n = 7; Student’s t test, t = 1.304 df = 12, p = 0.2167) but show significant reduction in inhibitory neurons (familiar taste 1.018 ± 0.092 AU, n = 7; novel taste 0.716 ± 0.061 AU, n = 7; Student’s t test, t = 2.72 df = 12, p = 0.0186). B, QR2 mRNA FISH-labeled expression levels are not significantly reduced in the dgIC in both excitatory (familiar taste 0.980 ± 0.024 AU, n = 7; novel taste 0.827 ± 0.081 AU, n = 7; Student’s t test, t = 1.801 df = 12, p = 0.0969) and inhibitory neurons (familiar taste 0.984 ± 0.114 AU, n = 7; novel taste 0.741 ± 0.095 AU, n = 7; Student’s t test, t = 1.636 df = 12, p = 0.1279). C, QR2 mRNA FISH-labeled expression levels are not significantly reduced in the agIC in both excitatory (familiar taste 1.008 ± 0.039 AU, n = 7; novel taste 0.920 ± 0.043 AU, n = 7; Student’s t test, t = 1.478 df = 12, p = 0.1652) and inhibitory neurons (familiar taste 0.993 ± 0.090 AU, n = 7; novel taste 0.803 ± 0.069 AU, n = 7; Student’s t test, t = 1.658 df = 12, p = 0.1233). D, QR2 mRNA FISH-labeled expression levels are reduced in layers 2/3 in the aIC in both excitatory (familiar taste 0.993 ± 0.025 AU, n = 7; novel taste 0.861 ± 0.052 AU, n = 7; Student’s t test, t = 2.247 df = 12, p = 0.0443) and inhibitory neurons (familiar taste 0.995 ± 0.087 AU, n = 7; novel taste 0.697 ± 0.069 AU, n = 7; Student’s t test, t = 2.665 df = 12, p = 0.0206). E, QR2 mRNA FISH-labeled expression levels are not significantly reduced in layers 5/6 in the aIC in both excitatory (familiar taste 1.008 ± 0.019 AU, n = 7; novel taste 0.923 ± 0.061 AU, n = 7; Mann–Whitney test, p = 0.0973) and inhibitory neurons (familiar taste 1.007 ± 0.117 AU, n = 7; novel taste 0.764 ± 0.062 AU, n = 7; Student’s t test, t = 1.816 df = 12, p = 0.0944). F, Representative image of the mouse aIC probed for vGlut (white), GAD (green), and QR2 (red). Outlines denote aIC and subregions (gIC, granular IC; dgIC, disgranular IC; agIC, agranular IC). Data are shown as mean ± SEM; *p < 0.05.
