Figure 1.

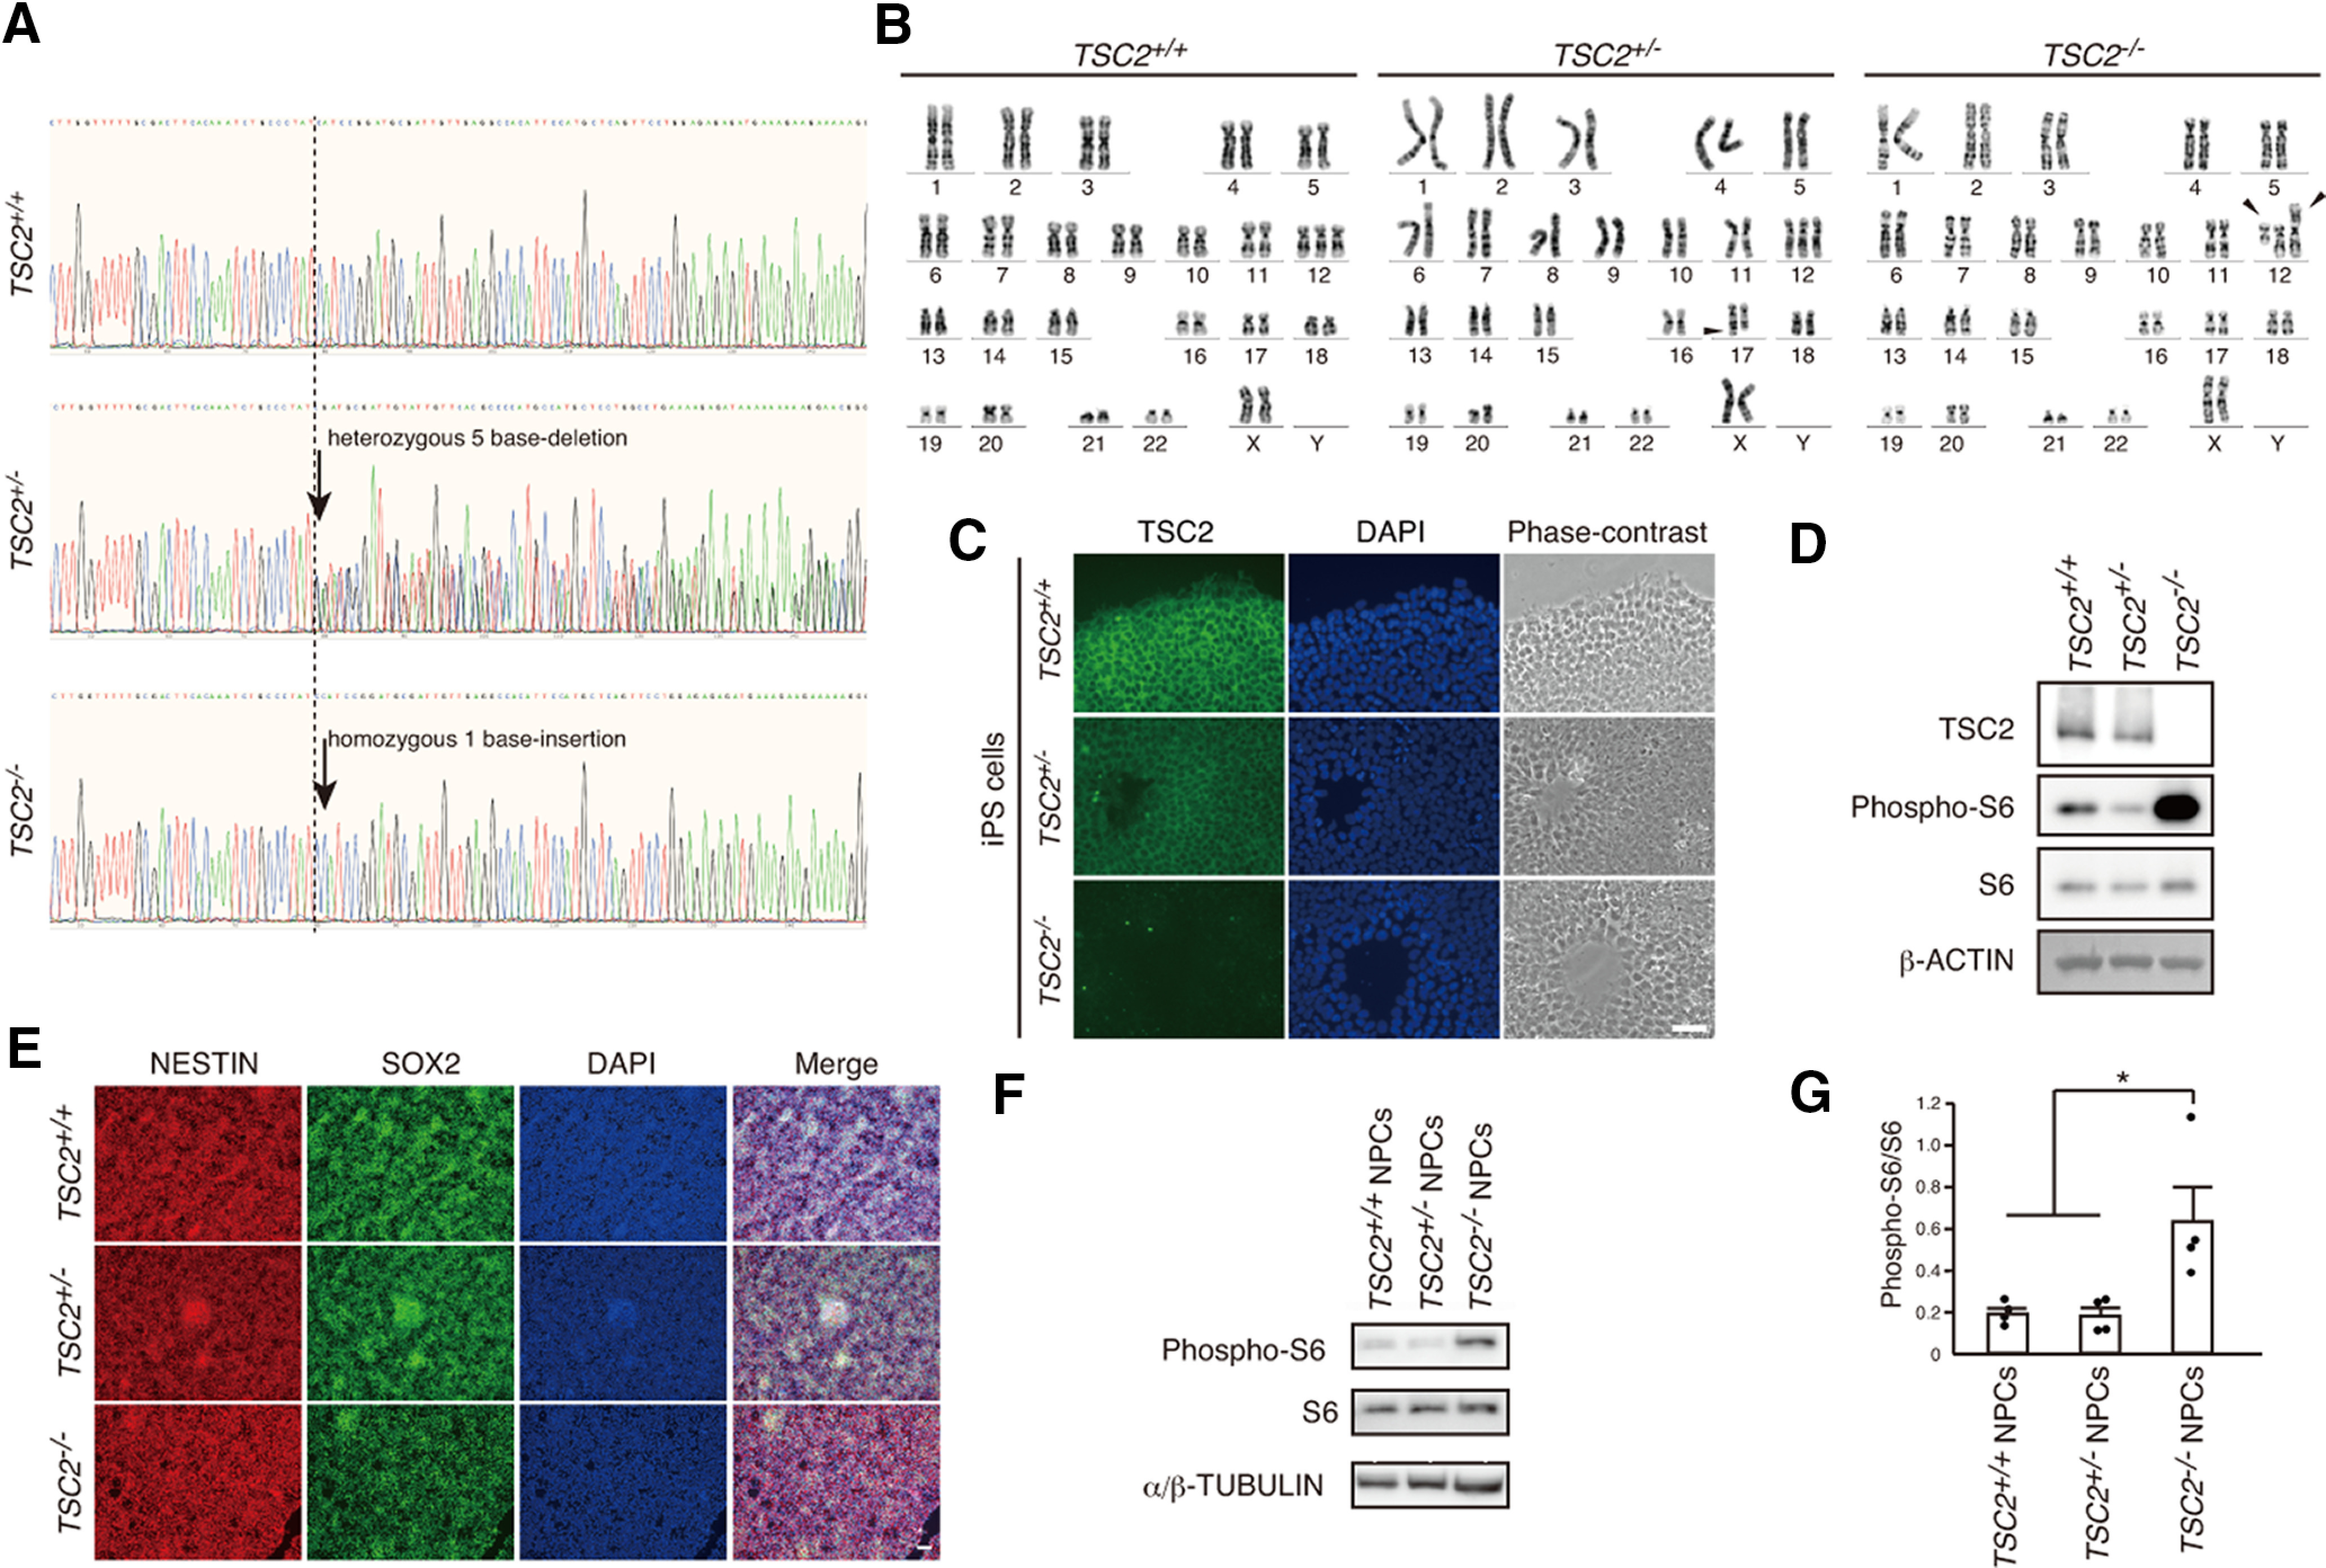
Characterization of TSC2-modified iPSCs and NPCs. A, DNA sequences of exon 3 in the TSC2 gene of TSC2+/+, TSC2+/−, and TSC2−/− iPSCs. TSC2+/− and TSC2−/− iPSCs had a heterozygous 5 base deletion and a homozygous 1 base insertion, respectively, as indicated by the arrows. B, Analysis of karyotypes of TSC2+/+, TSC2+/−, and TSC2−/− iPSCs by G-banding. Middle, Arrowhead indicates addition of an unidentified short fragment to chromosome 17 of TSC2+/− iPSCs. Right, Arrowheads indicate whole-arm translocation between the two copies of chromosome 12 in TSC2−/− iPSCs. C, Immunostaining of TSC2 in TSC2+/+, TSC2+/−, and TSC2−/− iPSCs. Green represents TSC2. Blue represents DAPI. Scale bar, 50 µm. D, TSC2/TUBERIN and S6 phosphorylation (phospho-S6) levels in cell lysates of TSC2+/+, TSC2+/−, and TSC2−/− iPSCs. β-actin was used as the loading control. E, Expression of NESTIN and SOX2 in TSC2+/+, TSC2+/−, and TSC2−/− NPCs. Scale bar, 50 µm. F, Increased phospho-S6 levels in TSC2−/− NPCs. G, Relative phospho-S6 intensity in TSC2+/+, TSC2+/−, and TSC2−/− NPCs. Data are mean ± SD. Experiments were performed 4 times. One-way ANOVA: F(2,9) = 6.845, p = 0.0156. Bonferroni's multiple comparisons test, *p = 0.035, TSC2+/+ versus TSC2−/−; *p = 0.03, TSC2+/− versus TSC2−/−.
