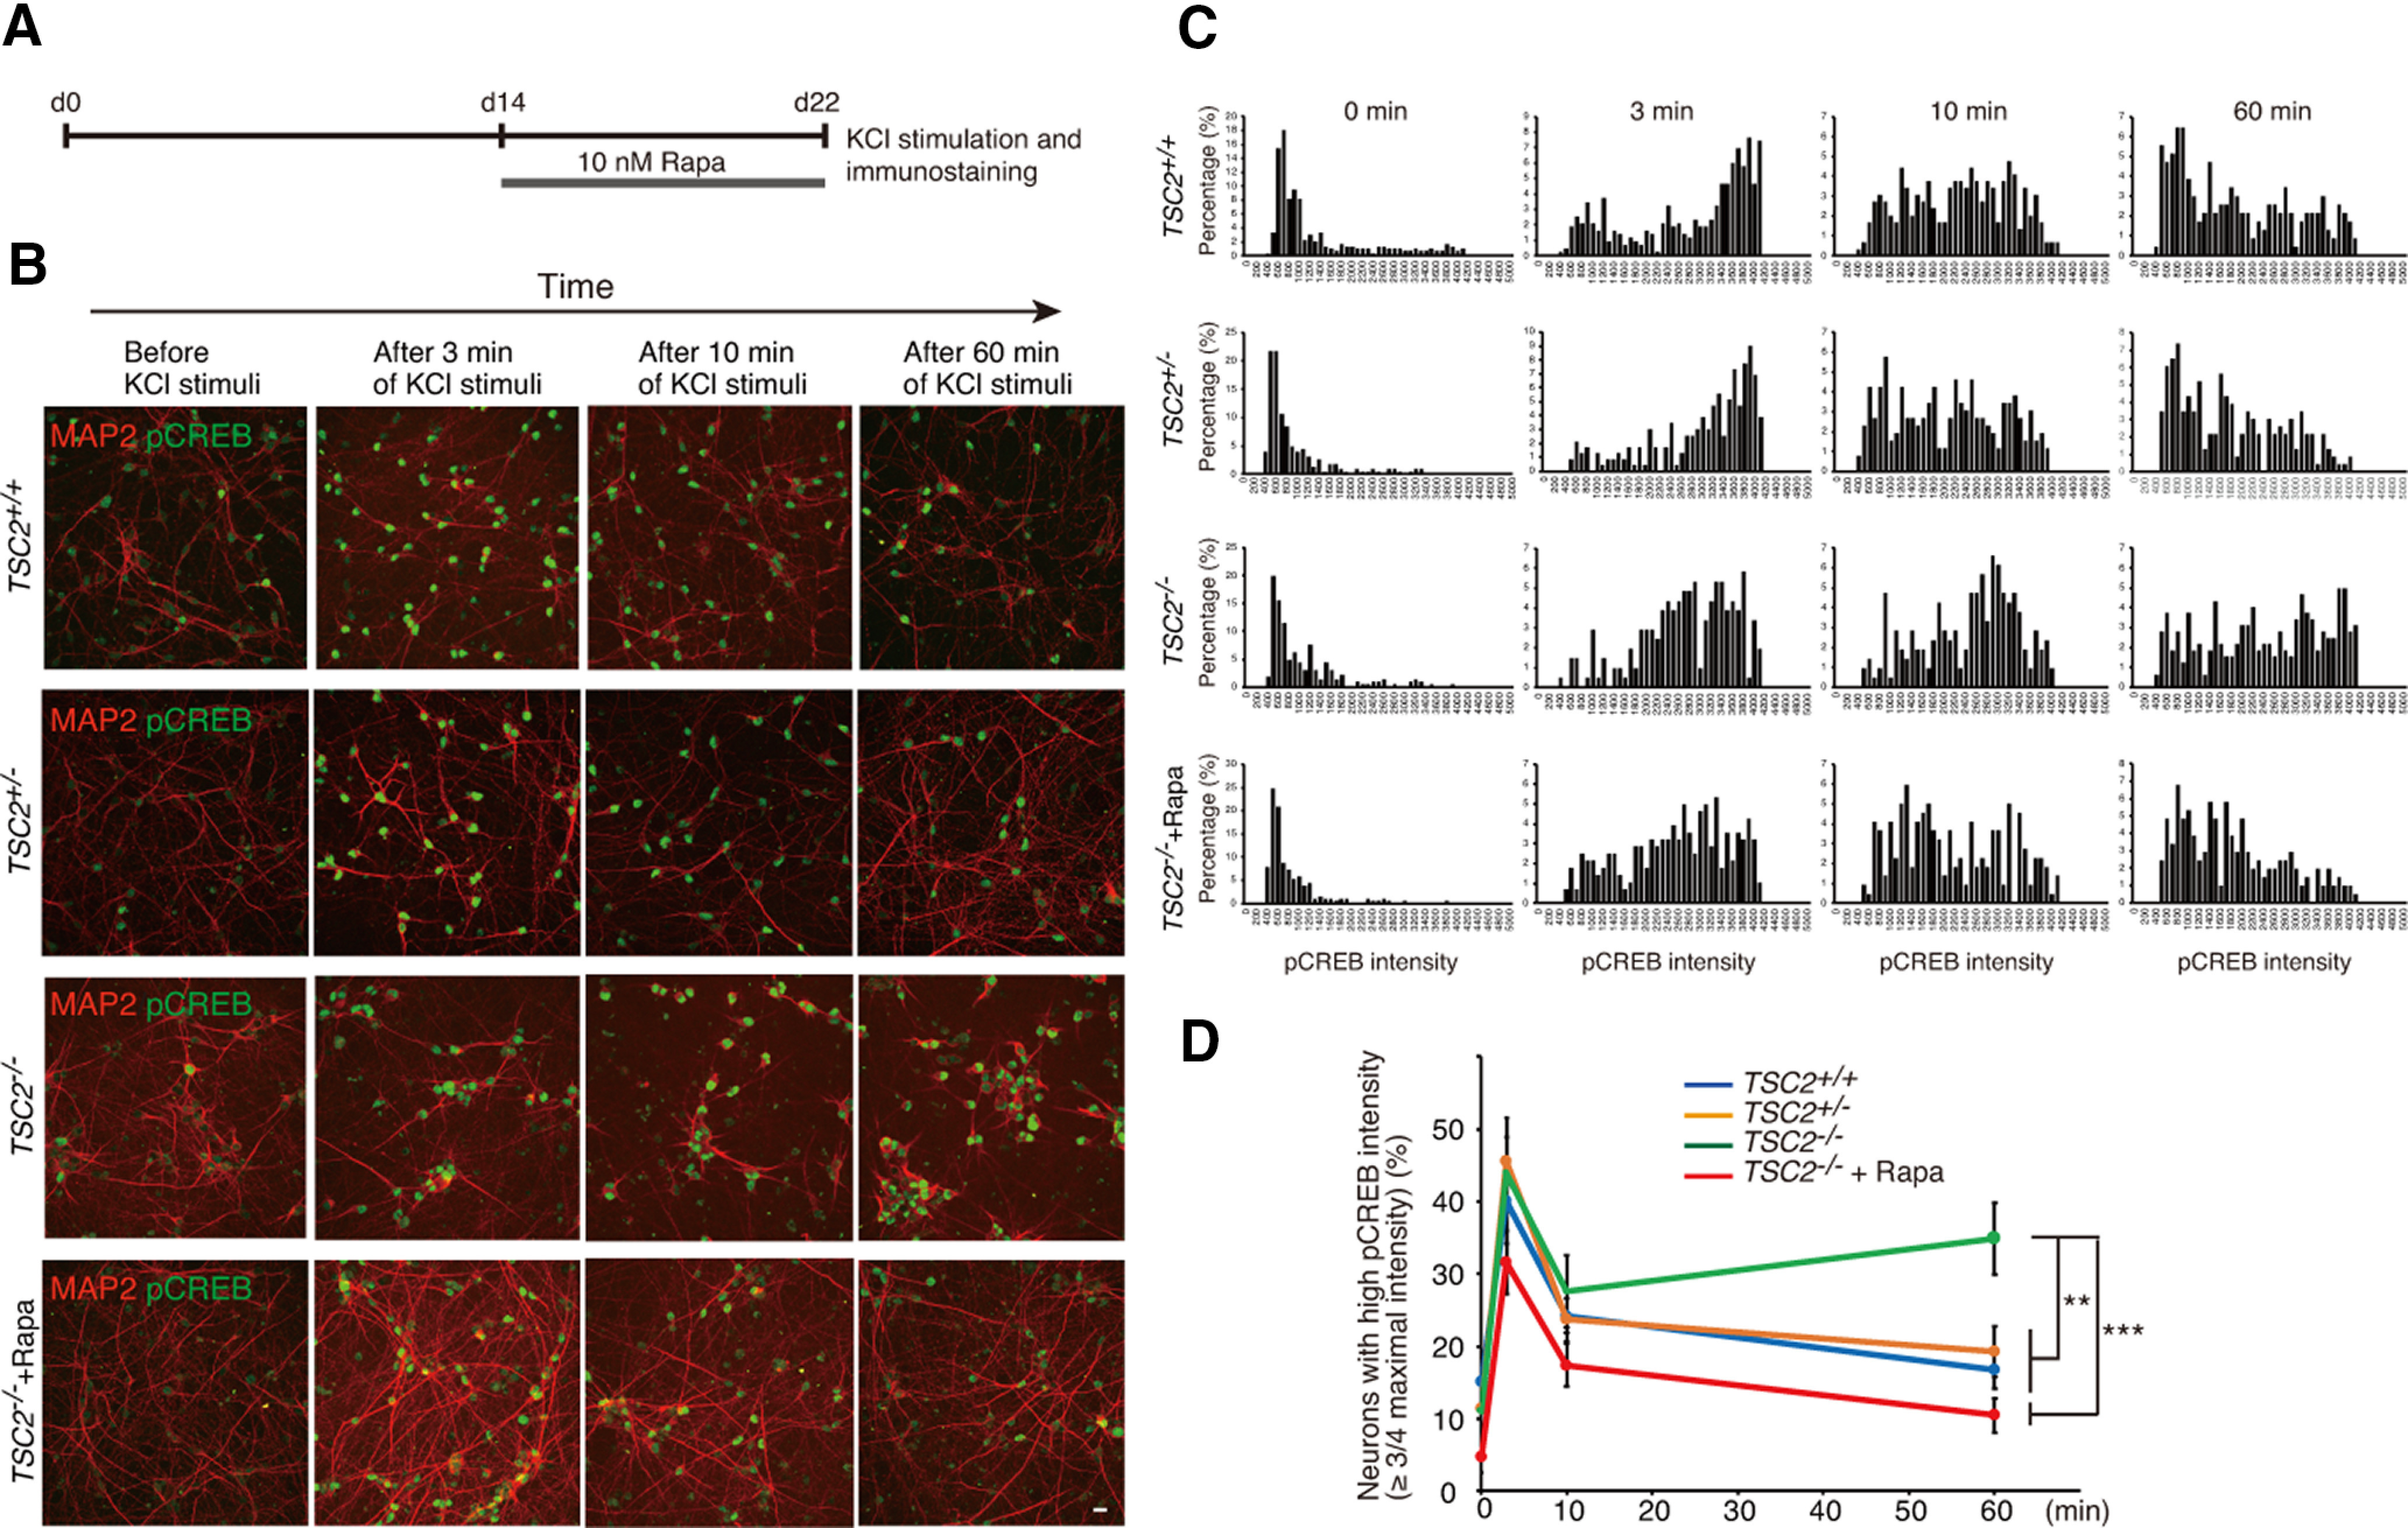
Figure 10.

Sustained activation of CREB in TSC2−/− neurons on membrane depolarization. A, Schematic illustration of rapamycin treatment, KCl stimulation, and immunostaining after plating NPCs for neuronal differentiation. B, Immunostaining of phospho-CREB (green) in TSC2+/+, TSC2+/−, TSC2−/−, and rapamycin-treated TSC2−/− neurons after membrane depolarization. Red represents MAP2. Scale bar, 50 µm. C, The intensity histograms of pCREB (arbitrary units) are shown. Experiments were performed at least 3 times with independent cultures. Representative data are shown. D, Percentage of neurons with high pCREB immunoreactivity (intensity> 3000). Data are mean ± SD; n = 4-8 experiments. For each experiment, 200-750 neurons were analyzed. Two-way repeated-measures ANOVA (genotype, F(3,56) = 3.6403), *p = 0.03038. Tukey HSD test, **p = 0.0051, TSC2+/− (n = 7) versus TSC2−/− (n = 6); ***p = 0.00073, TSC2−/− (n = 6) versus TSC2−/− + Rapa (n = 4); **p = 0.0013, TSC2+/+ (n = 8) versus TSC2−/− (n = 6).
