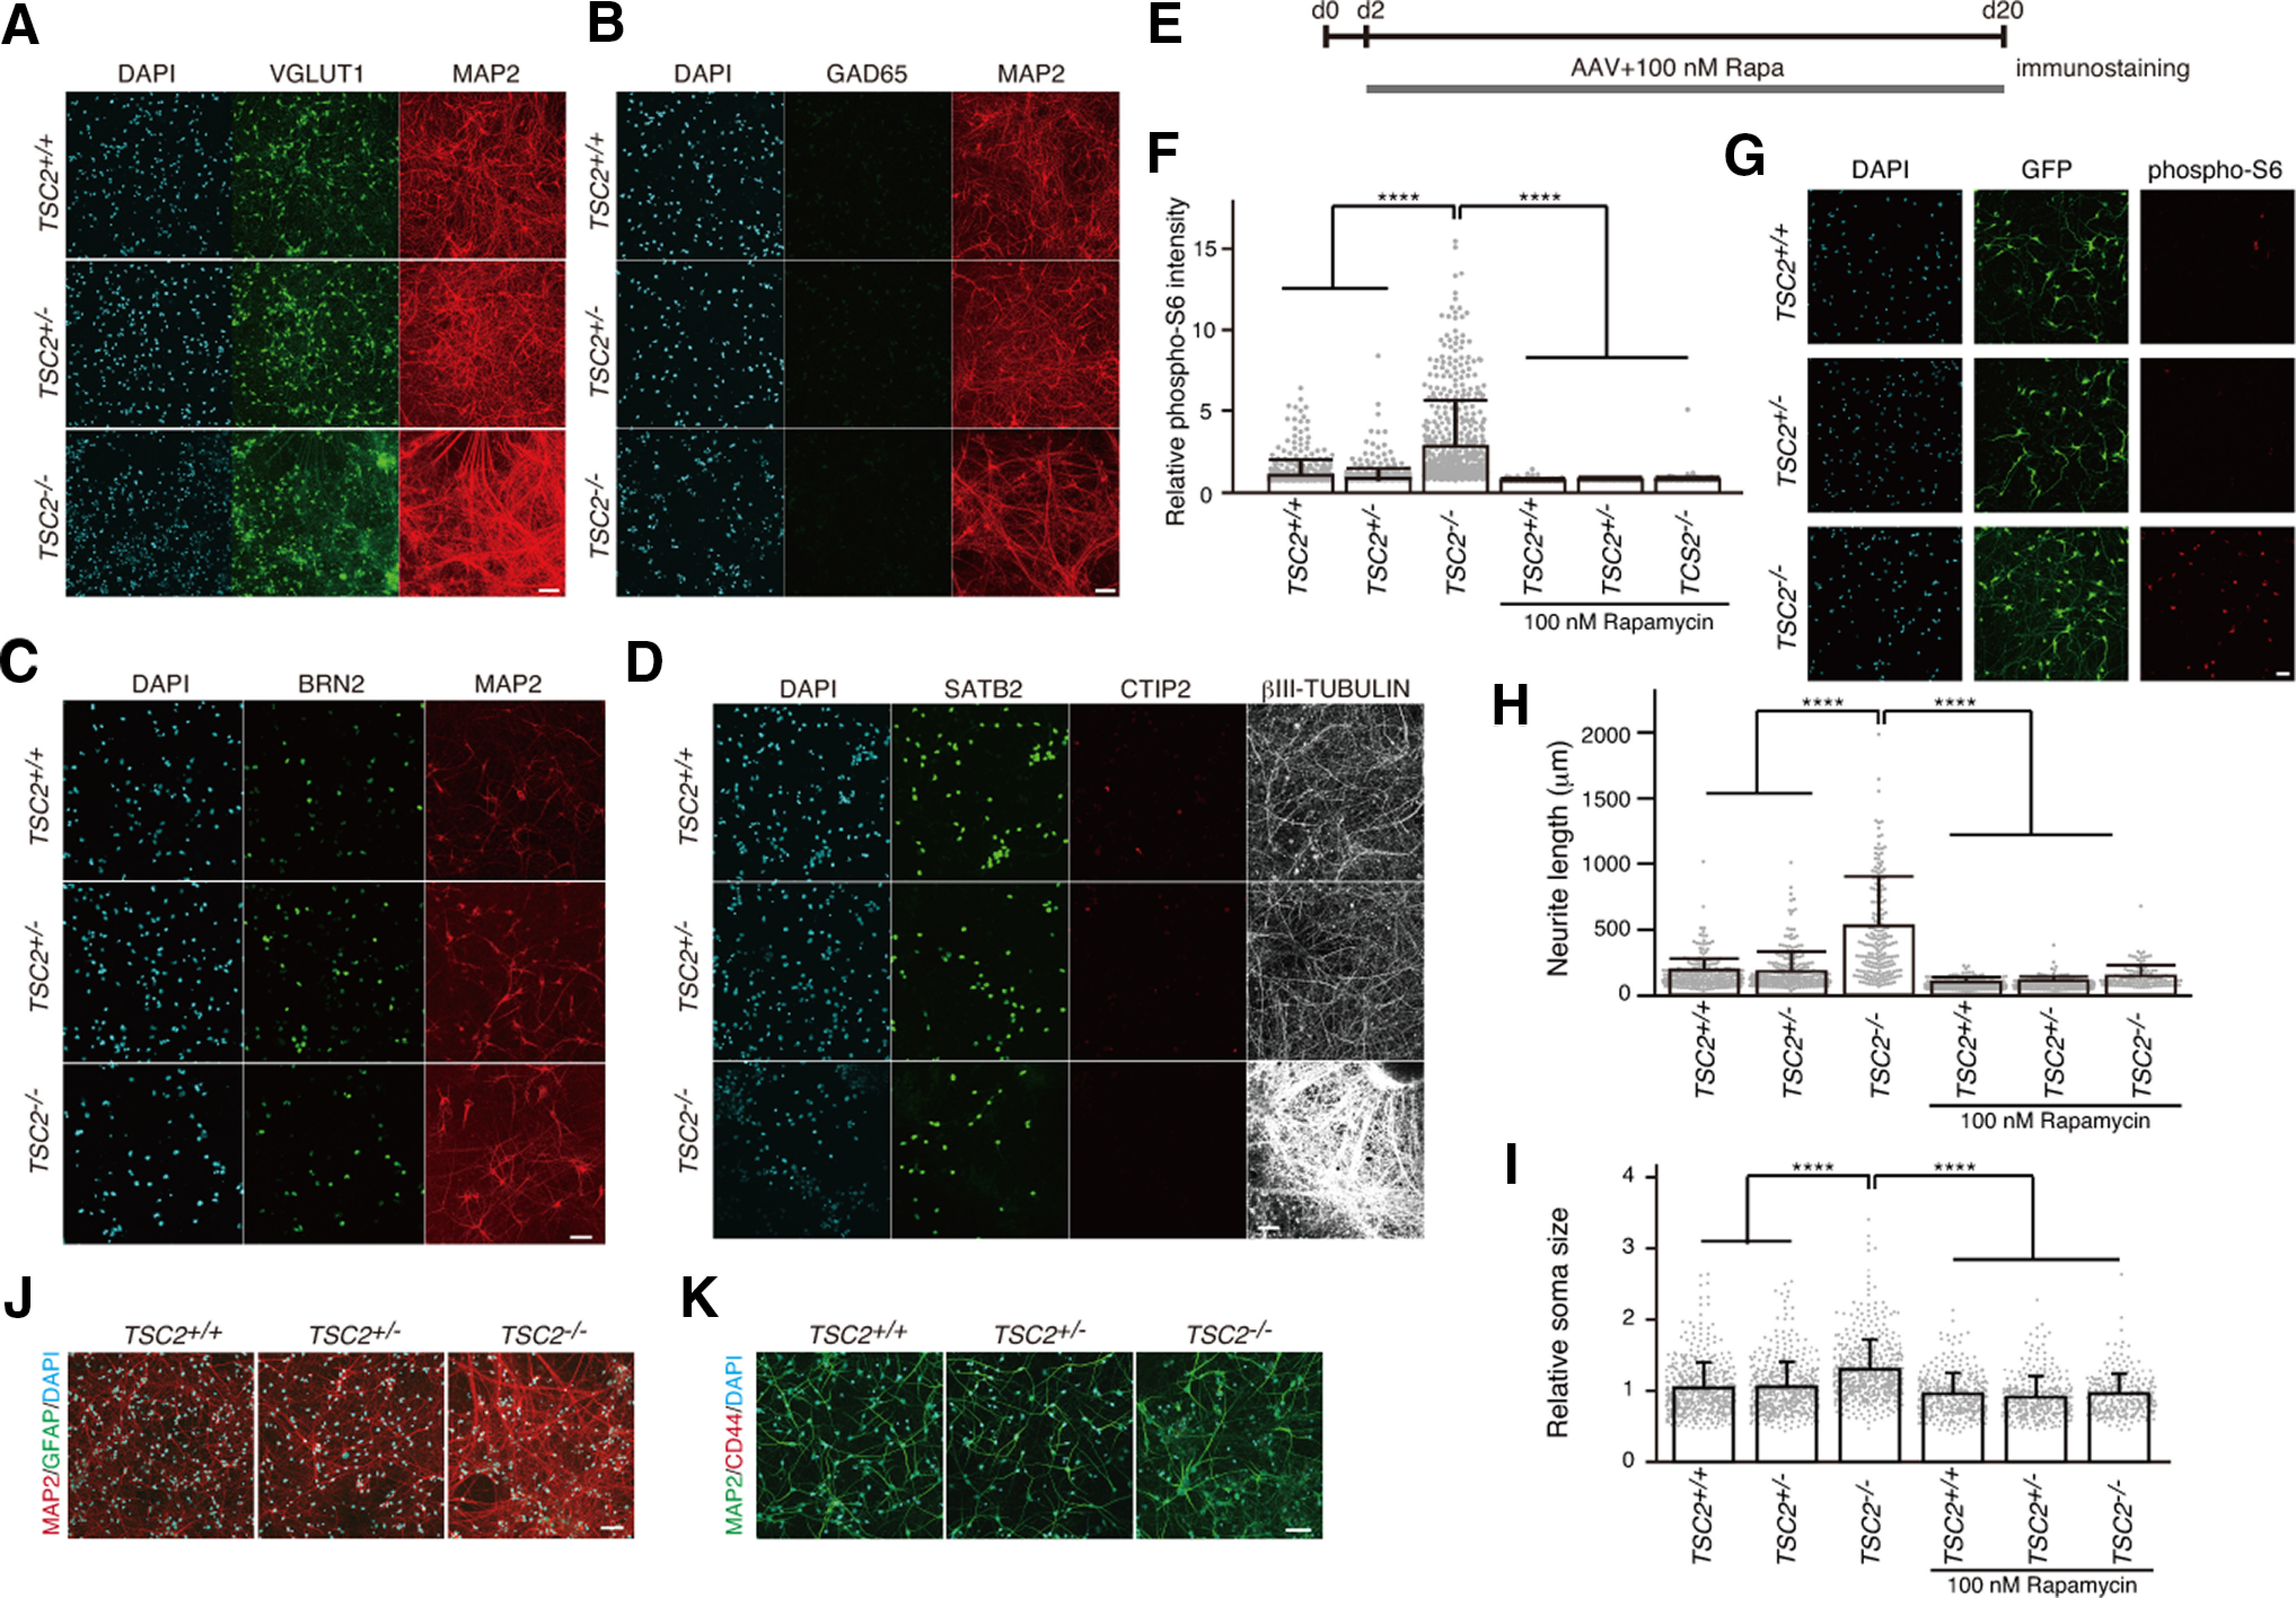
Figure 2.

mTOR-dependent abnormal morphology of human iPSC-derived TSC2−/− neurons. A, B, Immunostaining of iPSC-derived neurons with anti-vGLUT1, anti-GAD65, and anti-MAP2 antibodies at 23 d after neural differentiation from NPCs. C, D, Immunostaining of iPSC-derived neurons with anti-BRN2, anti-SATB2, anti-CTIP2, and anti-βIII-tubulin antibodies at ∼30 d after neural differentiation from NPCs. E, Schedule of application of AAV encoding EGFP and treatment with rapamycin after plating NPCs for neural differentiation at day 0 (d0). F, Relative phospho-S6 intensity of TSC2+/+, TSC2+/−, and TSC2−/− neurons at 23 d of neuronal differentiation. Kruskal–Wallis test, p < 0.0001. Steel test compared with TSC2−/− DMSO, ****p < 0.00001. The experiments were performed 3 times, and the number of neurons used for analysis was TSC2+/+ DMSO, 552; TSC2+/− DMSO, 522; TSC2−/− DMSO, 567; TSC2+/+ Rapa, 393; TSC2+/− Rapa, 349; and TSC2−/− Rapa, 289. G, Phospho-S6 signals in iPSC-derived TSC2+/+, TSC2+/−, and TSC2−/− neurons after 23 d. The cells were sparsely infected with AAVs encoding EGFP and stained with anti-GFP and anti-phospho S6 antibodies. Scale bar, 50 µm. H, Neurite length of TSC2+/+, TSC2+/−, and TSC2−/− neurons with or without 100 nm rapamycin treatment for 22 d from day 1 of neuronal differentiation. We measured the length of the longest and thin neurites of individual GFP-expressing neurons and defined them as the neurite length. Experiments were performed 4 times. Data are mean ± SD. Kruskal–Wallis test, p < 0.0001. Steel test compared with TSC2−/− DMSO, ****p < 0.00001. The number of cells used for analysis was TSC2+/+ DMSO, 298; TSC2+/− DMSO, 286; TSC2−/− DMSO, 196; TSC2+/+ Rapa, 396; TSC2+/− Rapa, 222; and TSC2−/− Rapa, 129. I, Relative soma size of TSC2+/+, TSC2+/−, and TSC2−/− neurons with or without 100 nm rapamycin treatment for 22 d from day 1 of neuronal differentiation. The experiments were performed 3 times. Data are mean ± SD. Kruskal–Wallis test, p < 0.0001. Steel test compared with TSC2−/− DMSO, ****p < 0.00001. The number of cells used for analysis was TSC2+/+ DMSO, 552; TSC2+/− DMSO, 522; TSC2−/− DMSO, 555; TSC2+/+ Rapa, 393; TSC2+/− Rapa, 349; and TSC2−/− Rapa, 289. J, K, Immunofluorescent staining of cultured cells with anti-GFAP, anti-CD44, and anti-MAP2 antibodies at ∼30 d after neural differentiation from NPCs. Scale bar, 50 µm.
