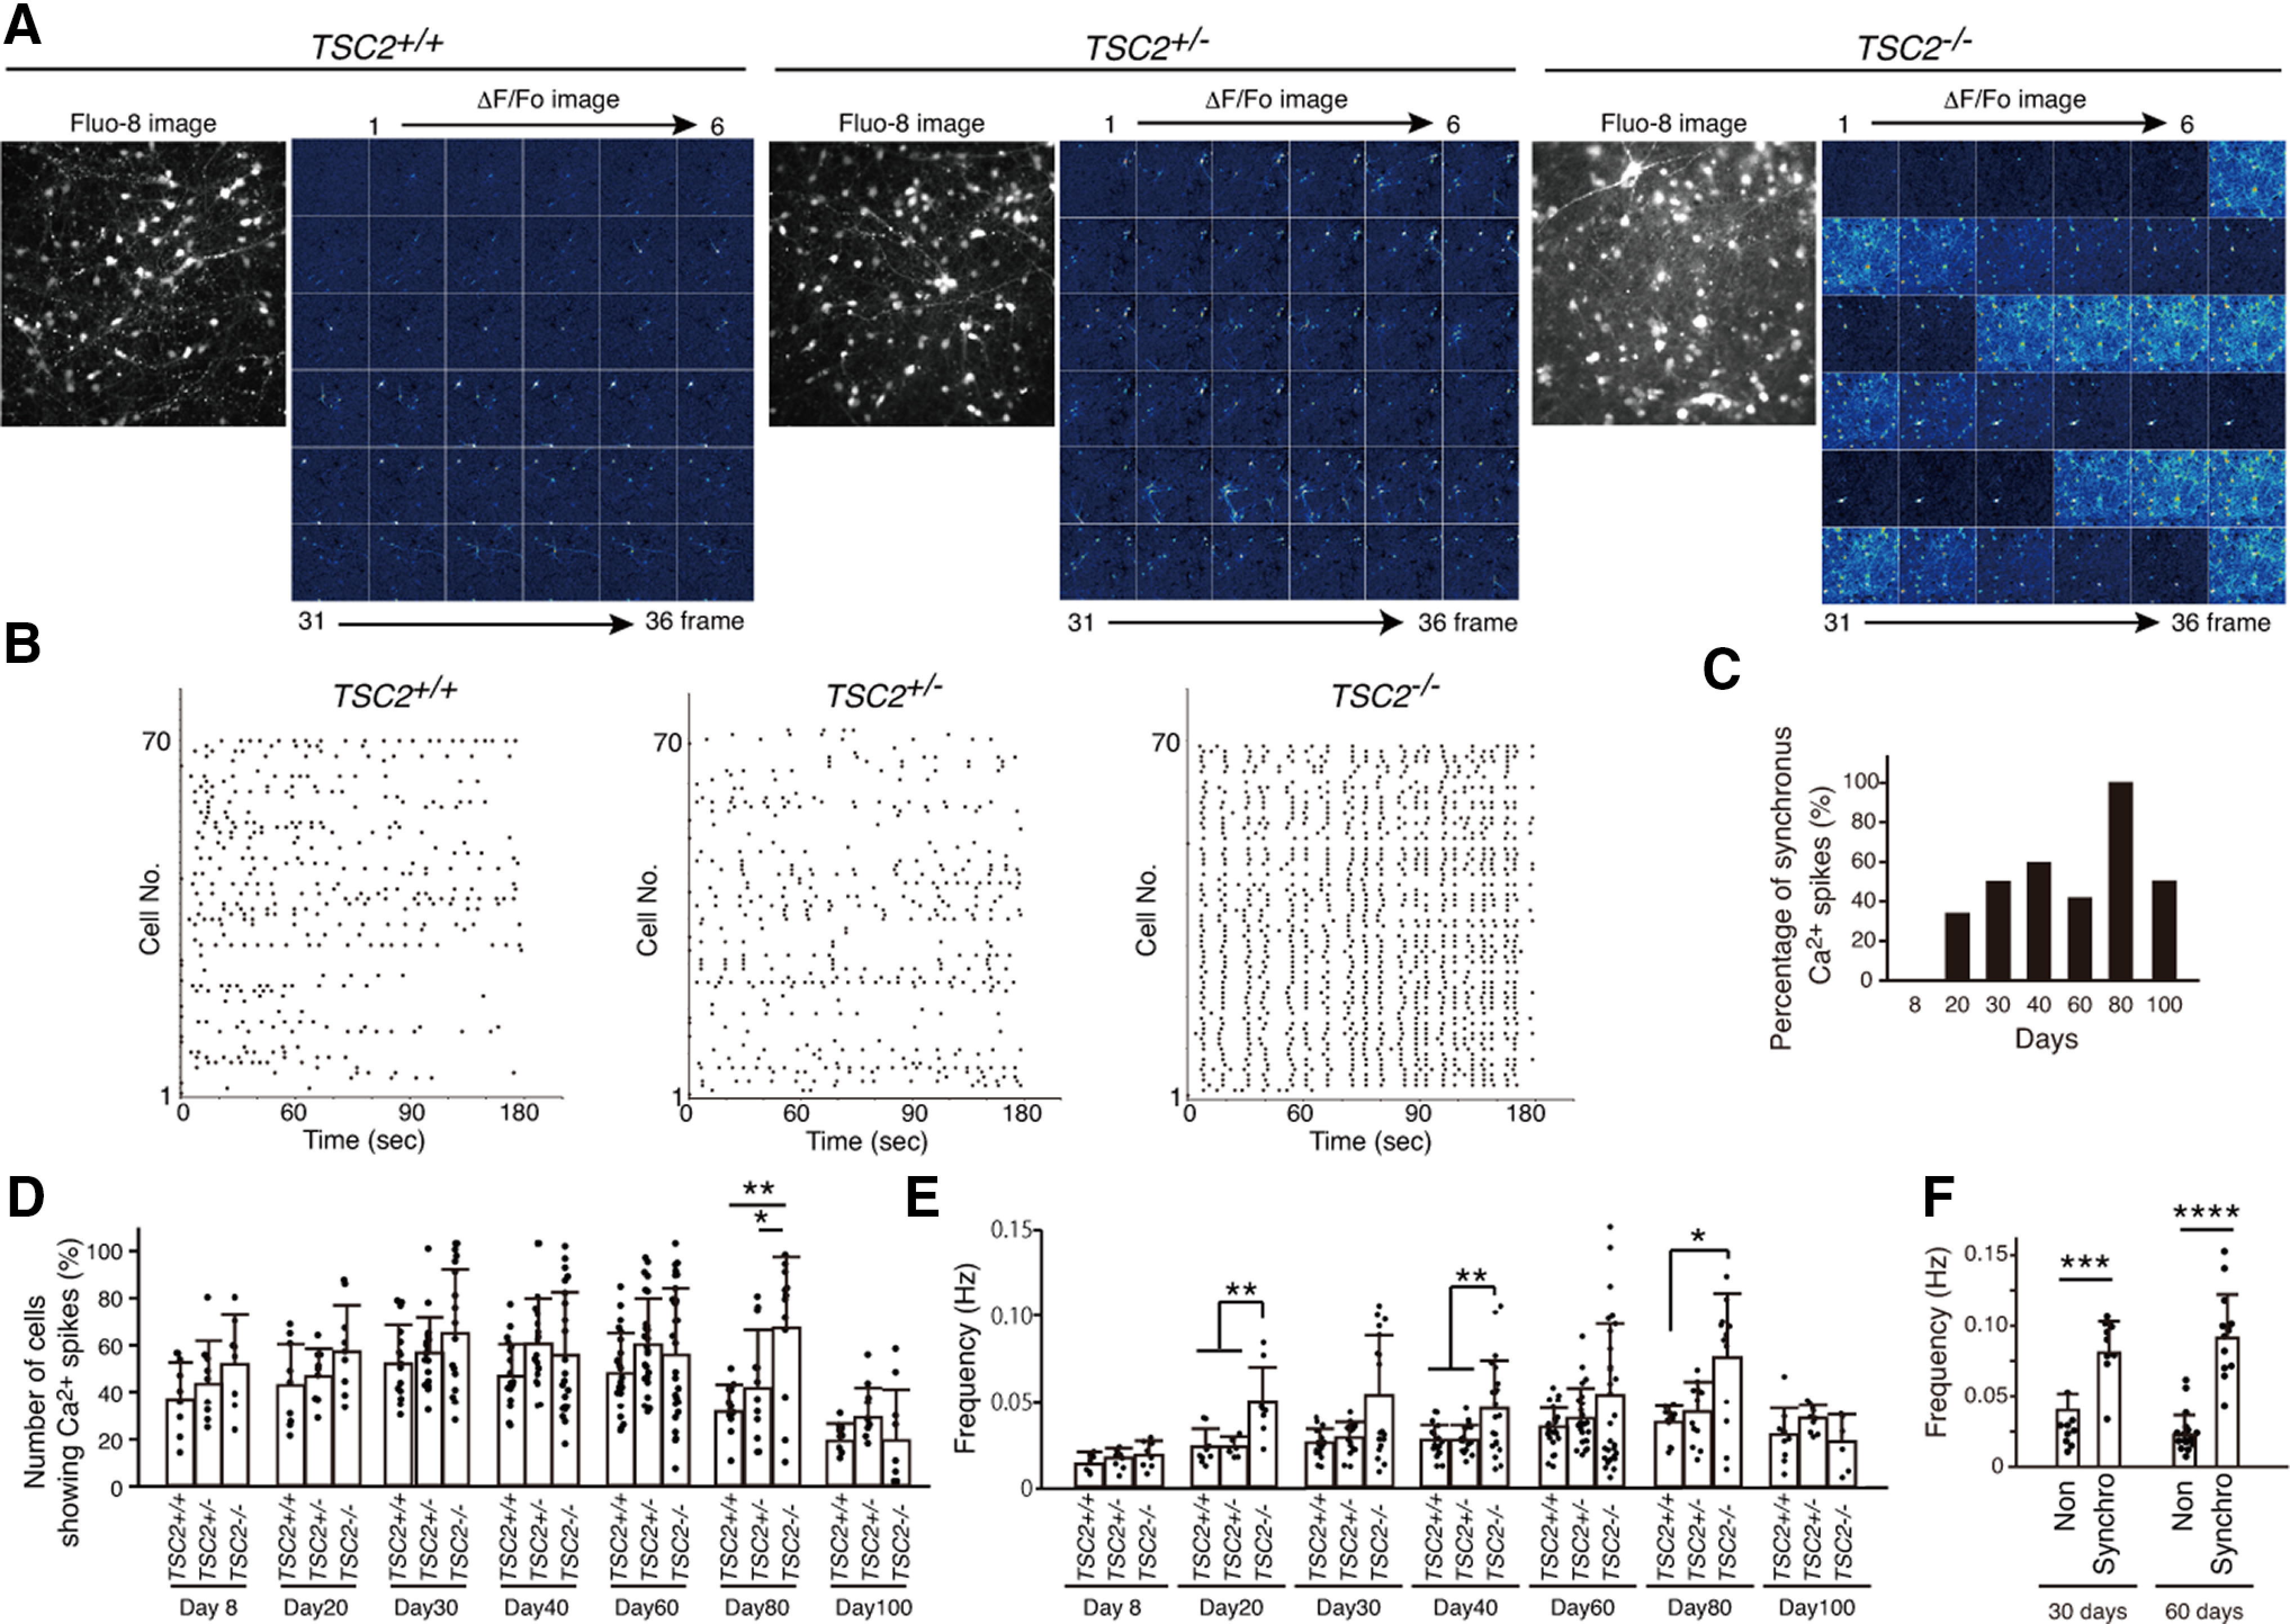
Figure 3.

Cultured TSC2−/− neurons exhibited synchronous neuronal activity. A, Ca2+ dynamics of iPS-derived TSC2+/+, TSC2+/−, and TSC2−/− neurons at 33 d. Fluorescence images of Fluo-8 and the ΔF/F0 changes in Fluo-8 signals are shown. Images were taken at 1 Hz. Thirty-six frames of ΔF/F0 changes in Fluo-8 are presented. B, Raster plots of Ca2+ spikes in TSC2+/+, TSC2+/−, and TSC2−/− neurons. Vertical axis represents the individual cells analyzed (∼1 in 70 cells). C, Developmental change in the percentage of experiments in which synchronous Ca2+ spikes were observed in TSC2−/− neurons. Each value was obtained from 6 to 29 independent experiments. D, Percentages of neurons exhibiting spontaneous Ca2+ spikes in TSC2+/+, TSC2+/−, and TSC2−/− neurons on various days of culture. Data are mean ± SD. The experimental numbers were 9-29 for each group. Day 8: one-way ANOVA, F(2,23) = 1.258, p = 0.296. Day 20: one-way ANOVA, F(2,24) = 2.042, p = 0.152. Day 30: one-way ANOVA, F(2,49) = 2.029, p = 0.142. Day 40: one-way ANOVA, F(2,57) = 2.031, p = 0.141. Day 60: one-way ANOVA, F(2,75) = 2.034, p = 0.138. Day 80: one-way ANOVA, F(2,34) = 7.907, p = 0.00151. Bonferroni's multiple comparisons test, **p = 0.0013, TSC2+/+ (n = 13) versus TSC2−/− (n = 12); *p = 0.0324, TSC2+/− (n = 12) versus TSC2−/− (n = 12). Day 100: one-way ANOVA, F(2,26) = 1.98, p = 0.158. E, Frequencies of Ca2+ spikes in TSC2+/+, TSC2+/−, and TSC2−/− neurons on various culture days of neuronal differentiation. The experimental numbers were 9-29 for each group. Day 8: one-way ANOVA, F(2,23) = 1.517, p= 0.24. Day 20: Kruskal–Wallis test, p = 0.001084, Steel–Dwass test, **p= 0.004896, TSC2+/+ (n = 9) versus TSC2−/− (n = 9); **p = 0.004896, TSC2+/− (n = 9) versus TSC2−/− (n = 9). Day 30: Kruskal–Wallis test, p = 0.0968. Day 40: one-way ANOVA, F(2,57) = 7.323, p = 0.00148, Bonferroni's multiple comparisons test, **p =0.0036, TSC2+/+ (n = 19) versus TSC2−/− (n = 19); **p = 0.0086, TSC2+/− (n = 19) versus TSC2−/− (n = 19). Day 60: Kruskal–Wallis test, p = 0.6337. Day 80: Kruskal–Wallis test, p = 0.0299, Steel test compared with TSC2−/−, *p = 0.03611, TSC2+/+ (n = 13) versus TSC2−/− (n = 12). Day 100: one-way ANOVA, F(2,23) = 2.644, p = 0.0926. F, Difference in Ca2+ spike frequencies between synchronized (synchro) and nonsynchronized (non) TSC2−/− neurons at 30 and 60 d. Data are mean ± SD. Day 30: Mann–Whitney U test, ***p = 0.00057. Day 60: Mann–Whitney U test, ****p = 0.0000105. The experimental number was synchronized (n = 9) and nonsynchronized (n = 9) at 30 d. The experimental number was synchronized (n = 12) and nonsynchronized (n = 17) at 60 d.
