Figure 4.
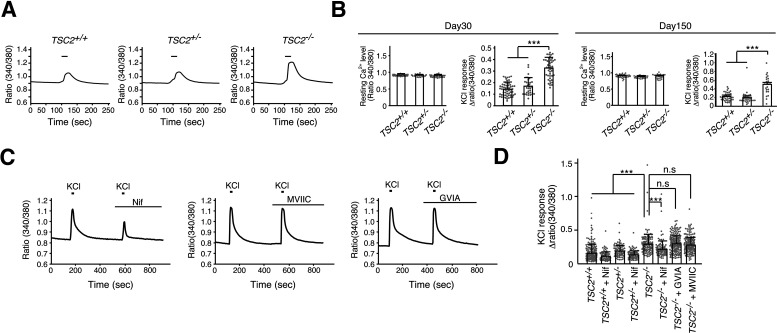
TSC2−/− neurons showed enhanced Ca2+ influx via LTCCs on membrane depolarization. A, Ca2+ response on membrane depolarization in iPSC-derived neurons with TSC2 mutations. The fluorescence ratio (340/380 nm) of fura-2 is shown. Bars represent 60 mm KCl stimulation for 20 s. B, Resting cytoplasmic Ca2+ levels and peak amplitude of Ca2+ influx into neurons on 60 mm KCl stimulation of 30-d-old (left) and 150-d-old (right) cultures. Data are mean ± SD. Resting Ca2+ level: day 30, one-way ANOVA, F(2,132) = 2.932, p = 0.0568; day 150, one-way ANOVA, F(2,83) = 2.824, p = 0.0651. The number of cells analyzed was 32-58 (30-d-old) and 23-35 (150-d-old). KCl response: day 30, Kruskal–Wallis test, p < 0.0001, Steel–Dwass test, ***p < 0.0001, TSC2+/+ (n = 58) versus TSC2−/− (n = 45); ***p < 0.0001, TSC2+/− (n = 32) versus TSC2−/− (n = 45). Day 150, Kruskal–Wallis test, p < 0.0001, Steel–Dwass test, ***p < 0.0001, TSC2+/+ (n = 35) versus TSC2−/− (n = 23); ***p < 0.0001, TSC2+/− (n = 29) versus TSC2−/− (n = 23). C, The effect of L-, P/Q-, and N-type VGCC blockers on Ca2+ signals of TSC2−/− neurons on membrane depolarization. Nif: 5 μm nifedipine; MVIIC: 1 μm ω-conotoxin MVIIC; GVIA: 1 μm ω-conotoxin GVIA. D, Ca2+ increases in neurons treated with Ca2+ channel blockers. Data are mean ± SD. Kruskal–Wallis test, p < 0.0001, Steel test compared with TSC2−/−, ***p < 0.0001, TSC2−/− (n = 156) versus TSC2−/− + Nif (n = 99); p = 0.705, TSC2−/− (n = 156) versus TSC2−/− + GVIA (n = 222); p = 0.9949, TSC2−/− (n = 156) versus TSC2−/− + MVIIC (n = 212). The number of cells used for analysis was 201, 82, 102, 102, 156, 99, 222, and 212 from the left bar to the right bar in the figure.

