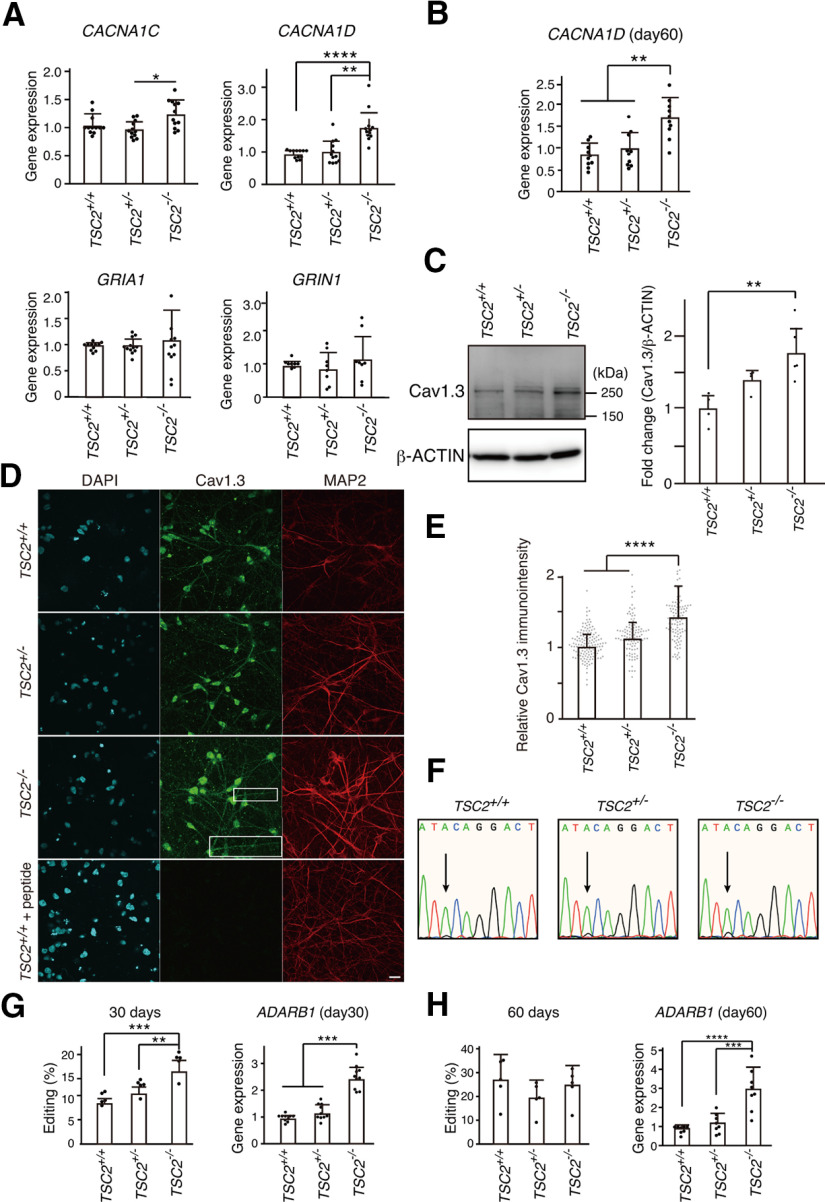
Figure 5.
CACNA1D expression was increased in TSC2−/− neurons. A, Relative gene expression in iPSC-derived neurons with TSC2 mutations at 30 d of neuronal differentiation. Data are mean ± SD. CACNA1C: Kruskal–Wallis test, p = 0.01387, Steel–Dwass test, p = 0.167, TSC2+/+ (n = 12) versus TSC2−/− (n = 12); p = 0.3740, TSC2+/+ (n = 12) versus TSC2+/− (n = 12); *p = 0.0154, TSC2+/− (n = 12) versus TSC2−/− (n = 12). CACNA1D: Kruskal–Wallis test, p < 0.0001, Steel–Dwass test, ****p = 0.000083, TSC2+/+ (n = 12) versus TSC2−/− (n = 12); **p = 0.00190, TSC2+/− (n = 12) versus TSC2−/− (n = 12). GRIA1: one-way ANOVA, F(2,32) = 0.2749, p = 0.761. GRIN1: one-way ANOVA, F(2,21) = 0.6872, p = 0.514. The experiments were performed using the cDNA from 4 to 6 independent cultures. B, Relative CACNA1D expression on day 60. Data are mean ± SD. Kruskal–Wallis test, p = 0.000899, Steel–Dwass test, **p = 0.00194, TSC2+/+ (n = 10) versus TSC2−/− (n = 10), **p = 0.00897, TSC2+/− (n = 10) versus TSC2−/− (n = 10). The data were obtained using cDNA from five independent cultures. C, Expression levels of Cav1.3 in TSC2+/+, TSC2+/−, and TSC2−/− neurons. The same amounts of protein lysates (∼10 µg) were immunoblotted with an anti-Cav1.3 antibody (Ab144). β-Actin was used as the loading control. Right, Fold change in Cav1.3 expression normalized to β-actin. One-way ANOVA, F(2,10) = 8.205, **p = 0.00778, Bonferroni's multiple comparisons test, **p = 0.007, TSC2+/+ (n = 4) versus TSC2−/− (n = 5); p = 0.234, TSC2+/+ (n = 4) versus TSC2+/− (n = 4), p = 0.229, TSC2+/− (n = 4) versus TSC2−/− (n = 5). D, Immunostaining of Cav1.3 (green, Alomone Labs, ACC-005) and MAP2 (red) in TSC2+/+, TSC2+/−, and TSC2−/− neurons. Scale bar, 20 µm. Inset, Magnified image of the white box area. E, Relative immune intensity of Cav1.3 in neurons at the soma. Kruskal–Wallis χ2 = 106.08, df = 2, ***p < 2.2 × 10⁻¹⁶. Steel test, ****p < 1 × 10⁻⁹, TSC2−/− (n = 112) versus TSC2+/+ (n = 141), ****p < 1 × 10⁻⁹, TSC2−/− (n = 112) versus TSC2+/− (n = 104). F, A-to-I editing of the IQ domain of CACNA1D. The electropherograms of direct sequencing of the CACNA1D gene from TSC2+/+, TSC2+/−, and TSC2−/− neurons are shown. Arrows indicate the adenine-to-guanine conversion signals. G, Percentage of A-to-I editing of CACNA1D cDNA on day 30 (left). Right, Expression levels of ADARB1 mRNA in the neurons. Data are mean ± SD. A-to-I editing: one-way ANOVA, F(2,12) = 20.70, p = 0.000129, Bonferroni's multiple comparisons test, ***p = 0.00011, TSC2+/+ (n = 5) versus TSC2−/− (n = 5); **p = 0.00383, TSC2+/− (n = 5) versus TSC2−/− (n = 5). ADARB1: one-way ANOVA, F(2,27) = 67.80, p < 0.0001, Bonferroni's multiple comparisons test, ***p < 0.0001, TSC2+/+ (n = 10) versus TSC2−/− (n = 10); ***p < 0.0001, TSC2+/− (n = 10) versus TSC2−/− (n = 10). All data were obtained from five independent cultures. H, A-to-I editing (%) and relative ADARB1 expression in 60-d-old neurons. Data are mean ± SD. A-to-I editing: one-way ANOVA, F(2,12) = 1.117, p = 0.359, n = 5 experiments. ADARB1: one-way ANOVA, F(2,21) = 20.66, p = 0.000011, Bonferroni's multiple comparisons test, ****p = 0.00002, TSC2+/+ (n = 8) versus TSC2−/− (n = 8); ***p = 0.00015, TSC2+/− (n = 8) versus TSC2−/− (n = 8). Data were obtained from five independent cultures.

