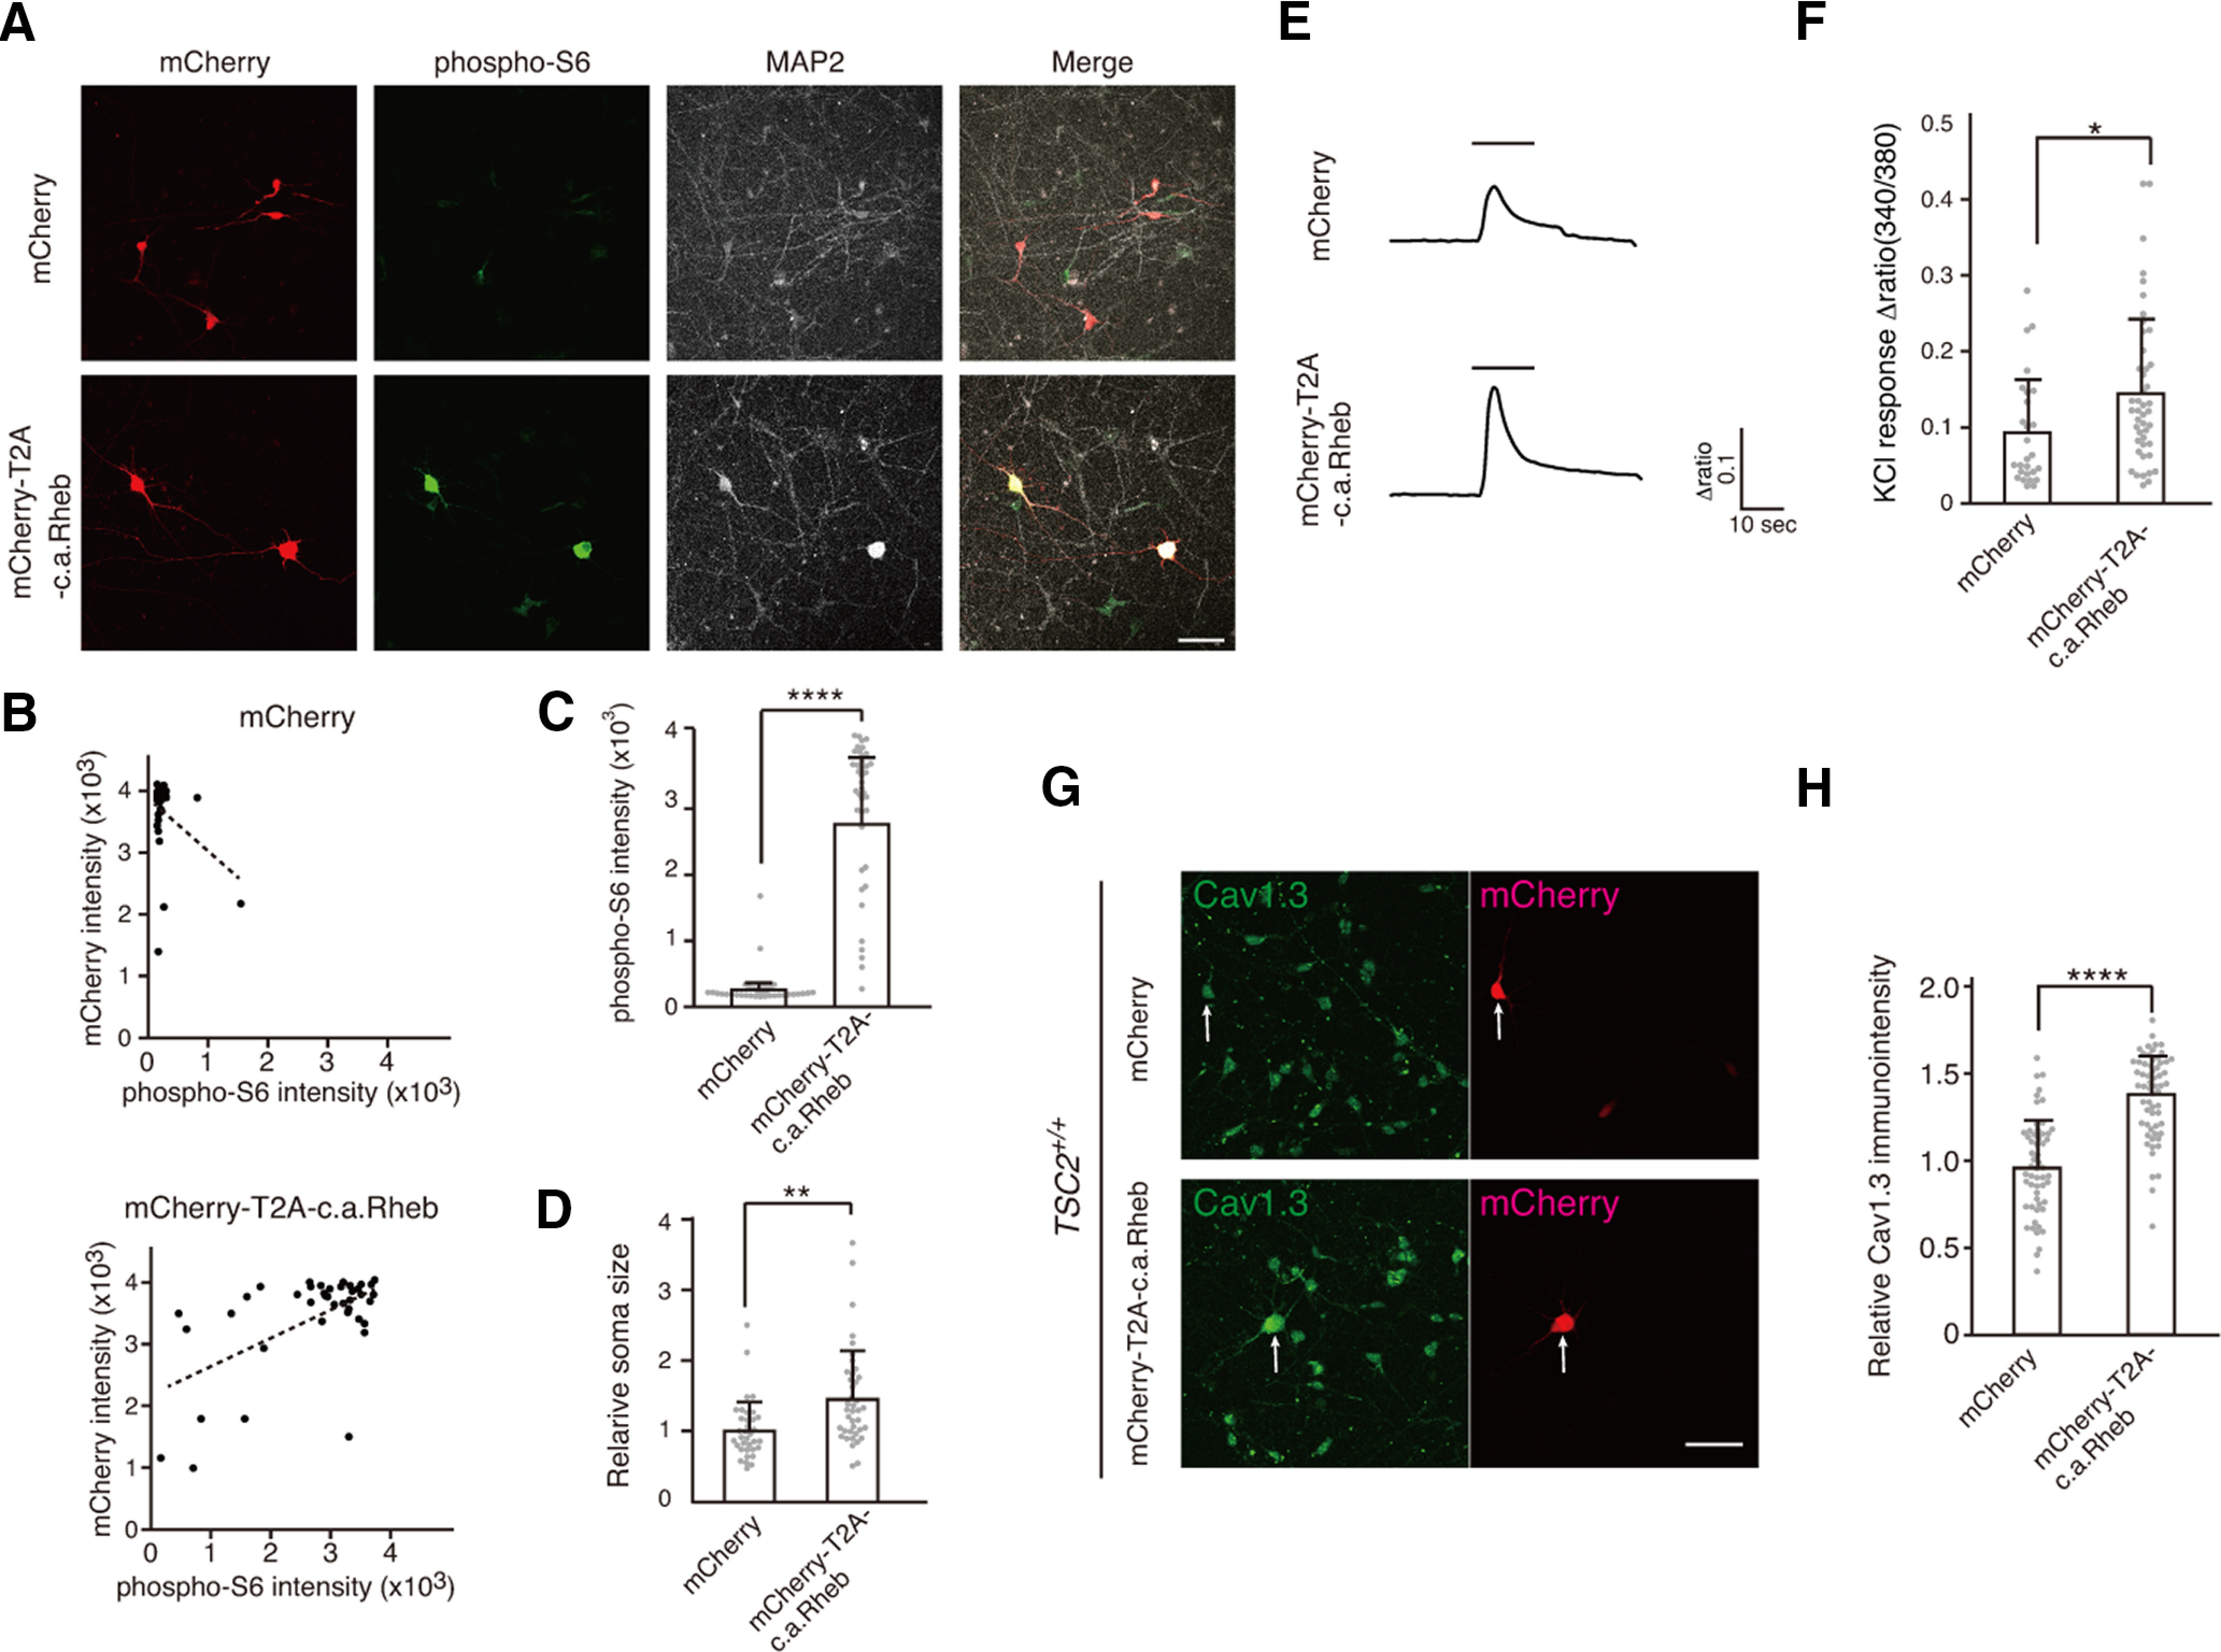
Figure 6.

c.a.Rheb increased Ca2+ influx and Cav1.3 expression in TSC2+/+ neurons. A, c.a.Rheb increases phospho-S6 intensity in TSC2+/+ neurons. TSC2+/+ neurons were transfected with plasmids encoding mCherry (top panels) or mCherry-T2A-c.a.Rheb (bottom panels) and stained with anti-phospho-S6 and MAP2 antibodies. Scale bar, 50 µm. B, Scatter plots for mCherry versus phospho-S6 signals in mCherry (top) or mCherry-T2A-c.a.Rheb (bottom)-transfected neurons. C, Mean signal intensity of phospho-S6 in mCherry (n = 35) and mCherry-T2A-c.a.Rheb (n = 40) transfected neurons. Mann–Whitney U test, ****p = 1.09 × 10⁻¹⁸. D, Soma size of mCherry (n = 35) and mCherry-T2A-c.a.Rheb (n = 40) transfected neurons. Welch two-sample t test, **p = 0.00104. E, Ca2+ signals in mCherry or mCherry-T2A-c.a.Rheb-expressing neurons on KCl stimulation. TSC2+/+ neurons were transfected with mCherry or mCherry-T2A-c.a.Rheb-expressing plasmids on days 8-9, and Ca2+ signals were measured with fura 2-AM on days 9-11 after transfection. Bars represent 60 mm KCl application. F, Quantification of peak height of Ca2+ transient on KCl stimulation in mCherry (n = 27) or mCherry-T2A-c.a.Rheb (n = 41) expressing neurons. Mann–Whitney U test, *p = 0.016. Data were obtained from 9 dishes of 3 independent cultures for each plasmid. G, Immunostaining of Cav1.3 (Alomone Labs, ACC-005) in mCherry or mCherry-T2A-c.a.Rheb-expressing TSC2+/+ neurons. Arrows indicate mCherry-positive neurons. Scale bar, 50 µm. H, Relative immunoactivity of Cav1.3 in mCherry (n = 56) or mCherry-T2A-c.a.Rheb (n = 61) expressing neurons. Immunosignals were normalized to Cav1.3 immunosignals of mCherry-negative cells in each well. Kolmogorov–Smirnov test, mCherry: p = 0.9148; mCherry-T2A-c.a.Rheb: p = 0.2991; F test= 0.76. p = 0.3068. Student t test, ****p = 4.835 × 10⁻¹⁴.
