Figure 7.
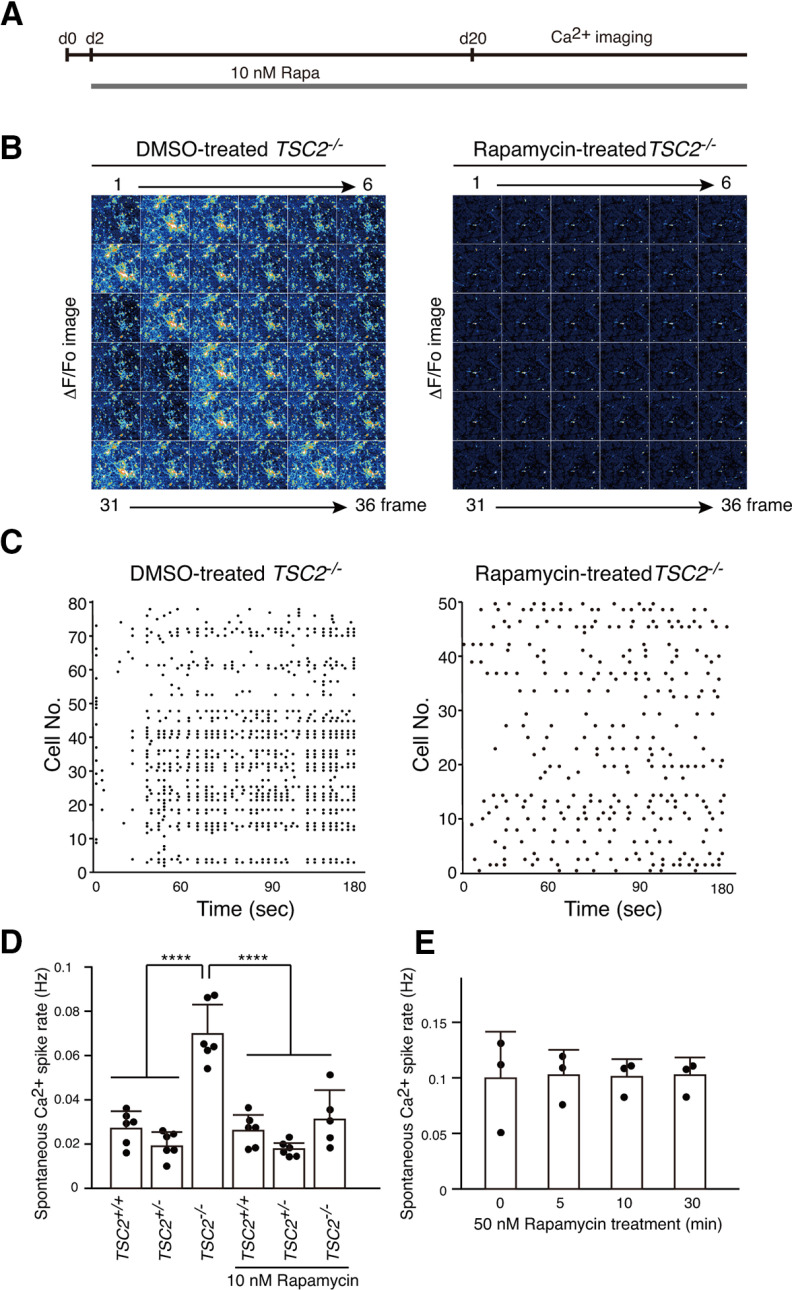
Long-term treatment of TSC2−/− neurons with rapamycin changed Ca2+ dynamics from synchronous to sporadic patterns. A, Schematic illustration of rapamycin treatment and Ca2+ imaging after plating NPCs for differentiation. B, Ca2+ dynamics of DMSO-treated (left) or rapamycin-treated (right) TSC2−/− neurons. The ΔF/F0 changes of the Fluo-8 signals for 36 frames are shown. Neurons that were treated with DMSO or 10 nm rapamycin for >18 d from day 2 of neuronal differentiation were used for the analysis. C, Raster plots of Ca2+ spikes from B. D, Ca2+ spike frequencies of TSC2+/+, TSC2+/−, and TSC2−/− neurons with or without rapamycin treatment. Data are mean ± SD. One-way ANOVA, F(5,29) = 26.88, p < 0.0001, Dunnett's multiple comparisons test compared with TSC2−/−, ****p < 0.00001. The number of experiments was 6 for each group except for TSC2−/− + Rapa (n = 5). E, Ca2+ spike frequencies of TSC2−/− neurons after treatment with 50 nm rapamycin for 5, 10, or 30 min. We used 50 nm rapamycin to completely and rapidly suppress the mTOR activity. The experiments were performed 3 times. One-way ANOVA, F(3,8) = 0.009871, p = 0.999.

