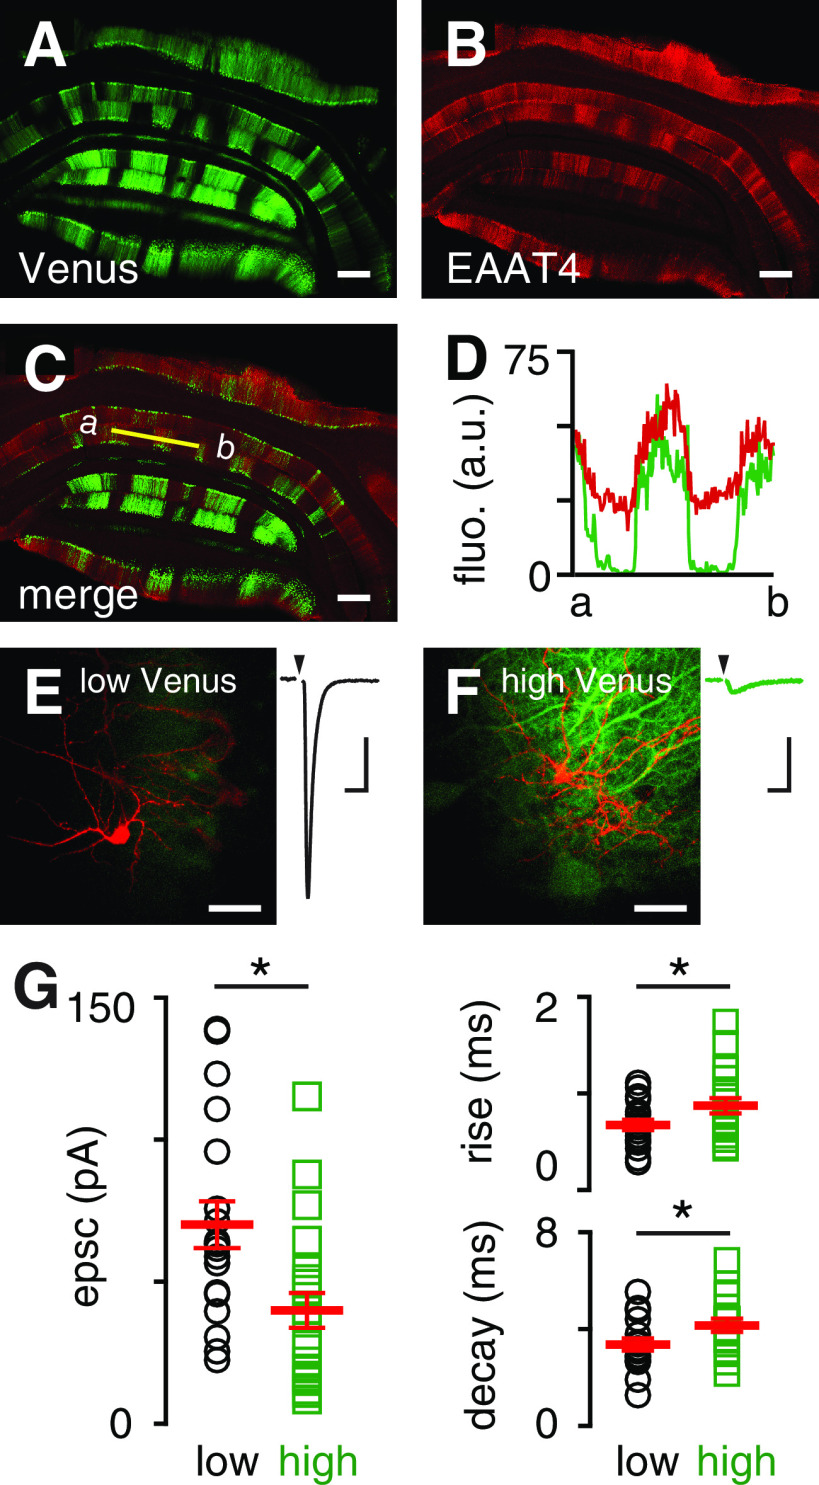
Figure 1.
MLIs in low EAAT4 regions have larger spillover responses. A, An example of a coronal section from a mouse expressing Venus under the Aldolase C promoter. B, EAAT4 antibody staining in the same coronal section. C, Overlay of Venus fluorescence and EAAT4 staining. Orientation: dorsal (top) to ventral (down). Scale bars, 200 µm. D, Intensity comparison from Venus and EAAT4 antibody staining (r = 0.81 ± 0.04; similar results from n = 6 regions of 3 sections). E, Representative two-photon imaging of a filled interneuron (red) in low Venus region and corresponding CF-mediated EPSC. F, Similar to E, a high Venus region. Scale bar, 30 µm. Calibration: 20 pA, 10 ms. G, Left, EPSC amplitude (low, black circles: 70.1 ± 8.2 pA, n = 19; high, green squares: 39.9 ± 6.1 pA, n = 21; p = 0.005; unpaired t test) and charge (low: 323.1 ± 46.1 fC, n = 19; high: 197.8 ± 25.0 fC, n = 20; p = 0.02; unpaired t test; not shown) were significantly smaller in high Venus regions. Right, EPSC rise times (20%-80%; low: 0.67 ± 0.05 ms, n = 19; high: 0.87 ± 0.08 ms, n = 21; p = 0.046; unpaired t test) and decay time constants (low: 3.4 ± 0.3 ms, n = 19; high: 4.2 ± 0.3 ms, n = 19; p = 0.04; unpaired t test) were slower in high Venus regions.

