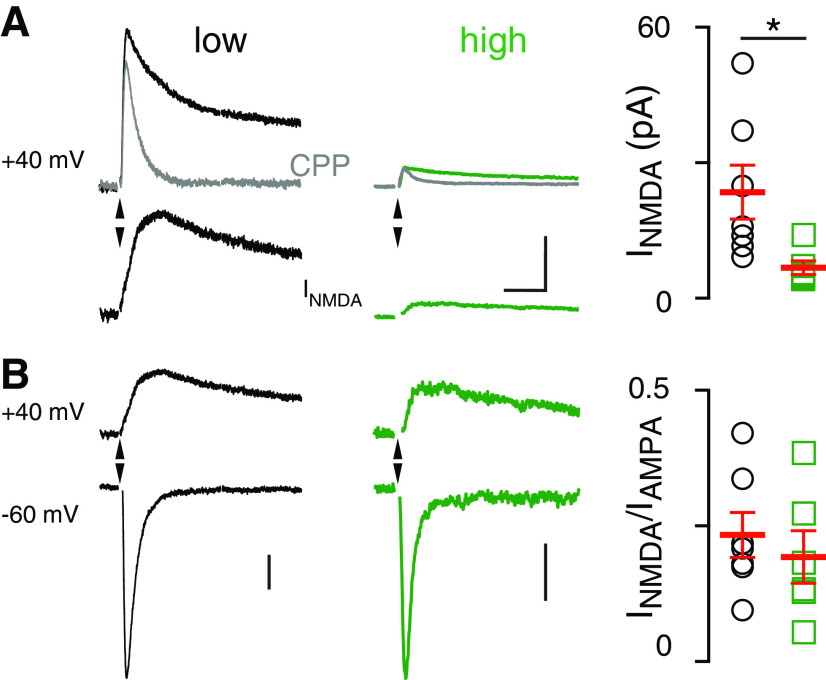
Figure 2.
Lower spillover-mediated NMDAR activation in high EAAT4 regions. A, Left, CF-mediated EPSCs at 40 mV before and after R-CPP (5 μm, gray) and NMDAR-mediated currents (bottom) obtained by subtracting these two traces in low (left) and high (middle) EAAT4 regions. Right, Summary showing that NMDAR EPSCs are larger in low EAAT4 regions. (Low: 29.1 ± 6.7 pA, n = 6; high: 5.6 ± 0.7 pA, n = 5; p = 0.01; unpaired t test). Scale bars, 20 pA, 40 ms. B, NMDAR and AMPAR responses at 40 and −60 mV, respectively, in low (left) and high (middle) EAAT4 regions. Right, Lack of difference in the NMDA/AMPA ratio between the high and low EAAT4 regions (low: n = 7; high: n = 6; p > 0.05; unpaired t test). Scale bars, 20 pA (left), 5 pA (right).

