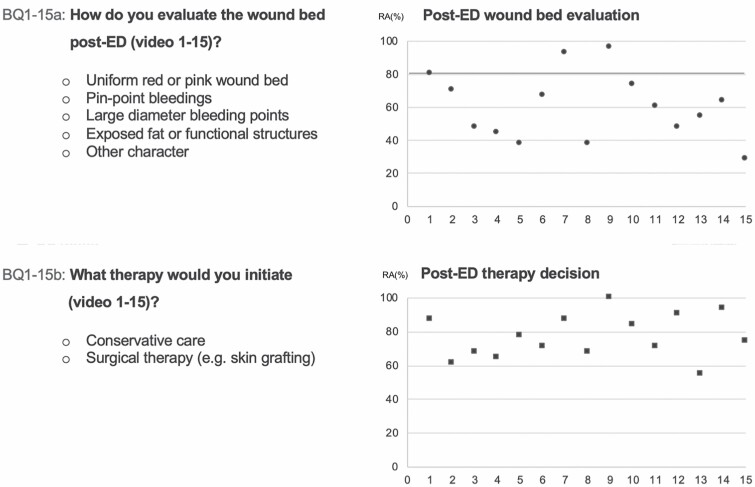
Figure 3.
Survey questions and multiple-choice answer possibilities of questions BQ1–15a (upper row, left) and BQ1–15b (lower row, left). Diagram of raw agreement (RA) of all participants’ responses to each multiple-choice questions BQ1–15a (right upper diagram) and BQ1–15b (right lower diagram). The x-axis of diagrams shows questions BQ1–15a (upper diagram) or BQ1–15b (lower diagram), and the y-axis shows RA in percent. For example, BQ1a achieved a RA of 80%. This means that 80% of participants chose the same answer.

