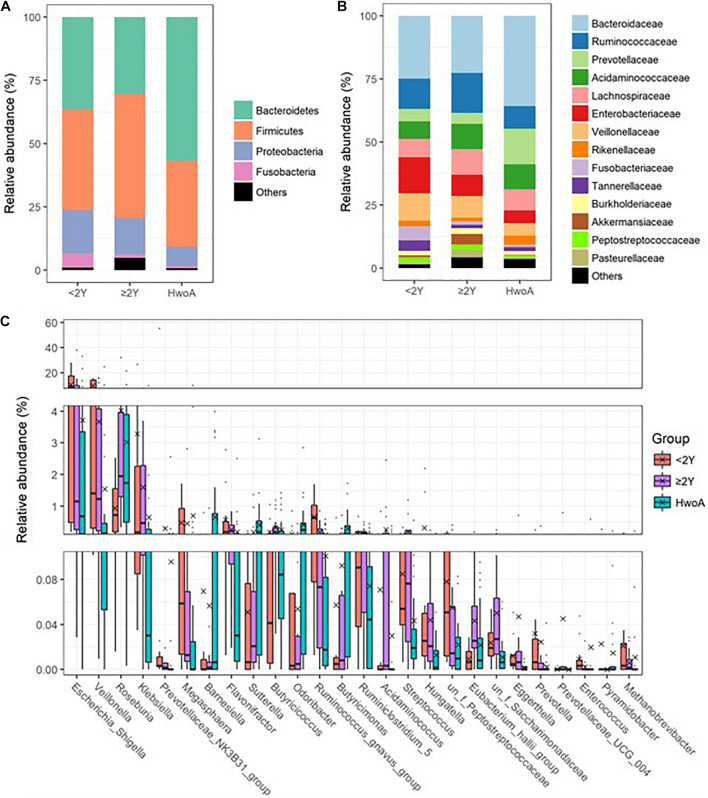
FIGURE 2.
Gut bacteria compositions and differences in the HwoA and HwA subgroups. The overall bacterial structures of the three groups at (A) phylum and (B) family levels, expressed as the relative abundance of OTUs in each group. (C) The relative abundances of major (> 0.01%) bacterial genera significantly differed among HwA subgroups (< 2Y and ≥ 2Y) and HwoA (p < 0.05). The “un_f” in bacterial nomenclature means unclassified family at genus level. OTUs, operational taxonomic units.

