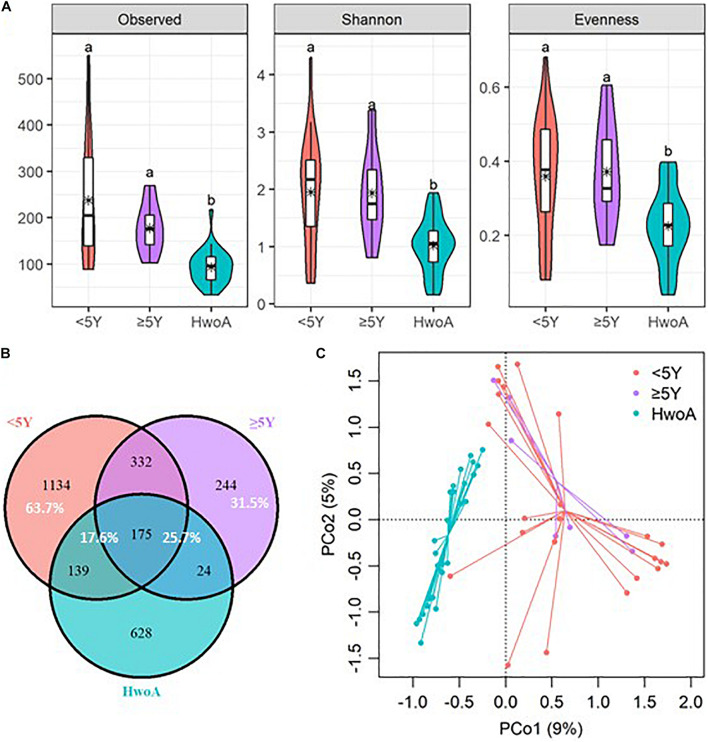
FIGURE 3.
Alterations of gut fungal diversity and communities, based on ITS2 sequencing data of HwoA, HwA_ < 5Y, and HwA_ ≥ 5Y. (A) Alpha diversity estimated by the observed, Shannon, and evenness indices. Letters indicate the grouping by Kruskal–Wallis rank-sum test with Benjamini–Hochberg corrections (p < 0.05). (B) Venn diagram of the OTUs shared by and exclusive to the three groups. Corresponding percentages are noted for relevant overlaps. (C) Differences in gut fungal community structures among the groups, assessed by principal coordinate (PCo) analysis of Bray–Curtis distance (p < 0.001). OTUs, operational taxonomic units.

