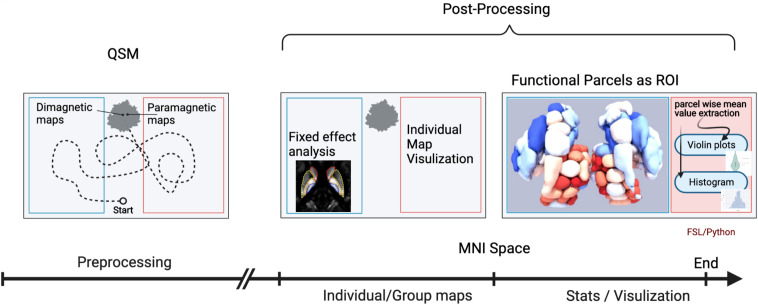
FIGURE 1.
Workflow of the quantitative susceptibility mapping (QSM) evaluation. An illustration of the workflow depicts the analysis steps. The first analysis step was a mix of several preprocessing steps: (1) generation of QSM maps by using background removal imposing image smoothness and moderate contrast; (2) transformation into standard MNI brain space, after co-registration to anatomy data of each individual subject with known spatial transformation (DARTEL), and reslicing onto a grid with isotropic 400 μm voxels using trilinear interpolation; (3) bifurcation/subdivision into diamagnetic and paramagnetic components. In the next step, the diamagnetic and paramagnetic maps were bifurcated from the normalized QSM maps. Afterward, in the post-processing steps, individual as well as group fixed maps were visualized. The last analysis step encompasses statistics and visualization of the group results. The graphical workflow was created with BioRender.com https://app.biorender.com/biorender-templates.

