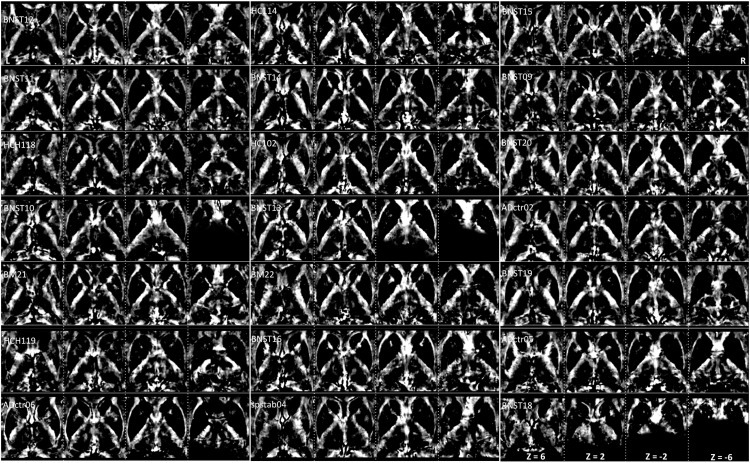
FIGURE 3.
Interindividual maps: QSM images of diamagnetic sources (myelin and calcium, etc.) were obtained from 21 subjects ordered with increasing age. The grayscale color code indicates brighter values in the highly myelinated structures. In the grayscale, brighter values indicate higher and darker lower values. Note the highest values in the internal capsule: Th, NC, PU, and GP display lower values. However, in the quantitative analysis, the difference converges, as the scale of differences in the visualization is heavily biased by the internal capsule fiber contrast. Three subjects (BNST10, BNST13, and BNST18) show only partial coverage.

