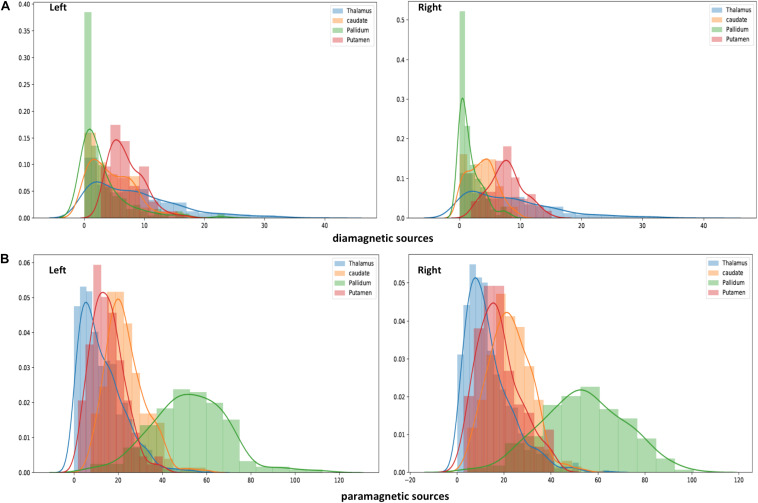
FIGURE 7.
Histogram of QSM-values in diamagnetic (A) and paramagnetic sources (B): Distribution of mean di- and paramagnetic sources within Th and BG. The different colors indicate corresponding structures. The X-axis depicts different QSM values and the Y-axis depicts the amount of each value. Note the differences, where the diamagnetic source, the pallidum, shows the first peak, caudate the second, putamen the third, and Th in the last, while for the mean paramagnetic source, Th shows the first peak, putamen the second, caudate the third, and pallidum the last. Overall, the diamagnetic sources span a more narrow range of values than paramagnetic sources.

