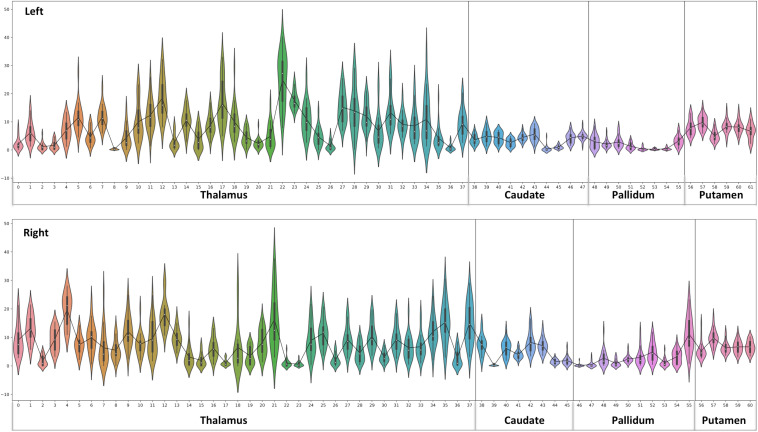
FIGURE 8.
Violin plot of Diamagnetic sources, i.e., myelin and calcium: The violin plot highlights only the mean of each parcel. The black-line plot shows only the mean values of all parcels in all subjects. First, note the overall lower values for the caudate and pallidum, and in contrast, putamen and several parcels in the Th show consistently higher pallidum parcel values. Second, the violin plot reveals inter-individual variability.

