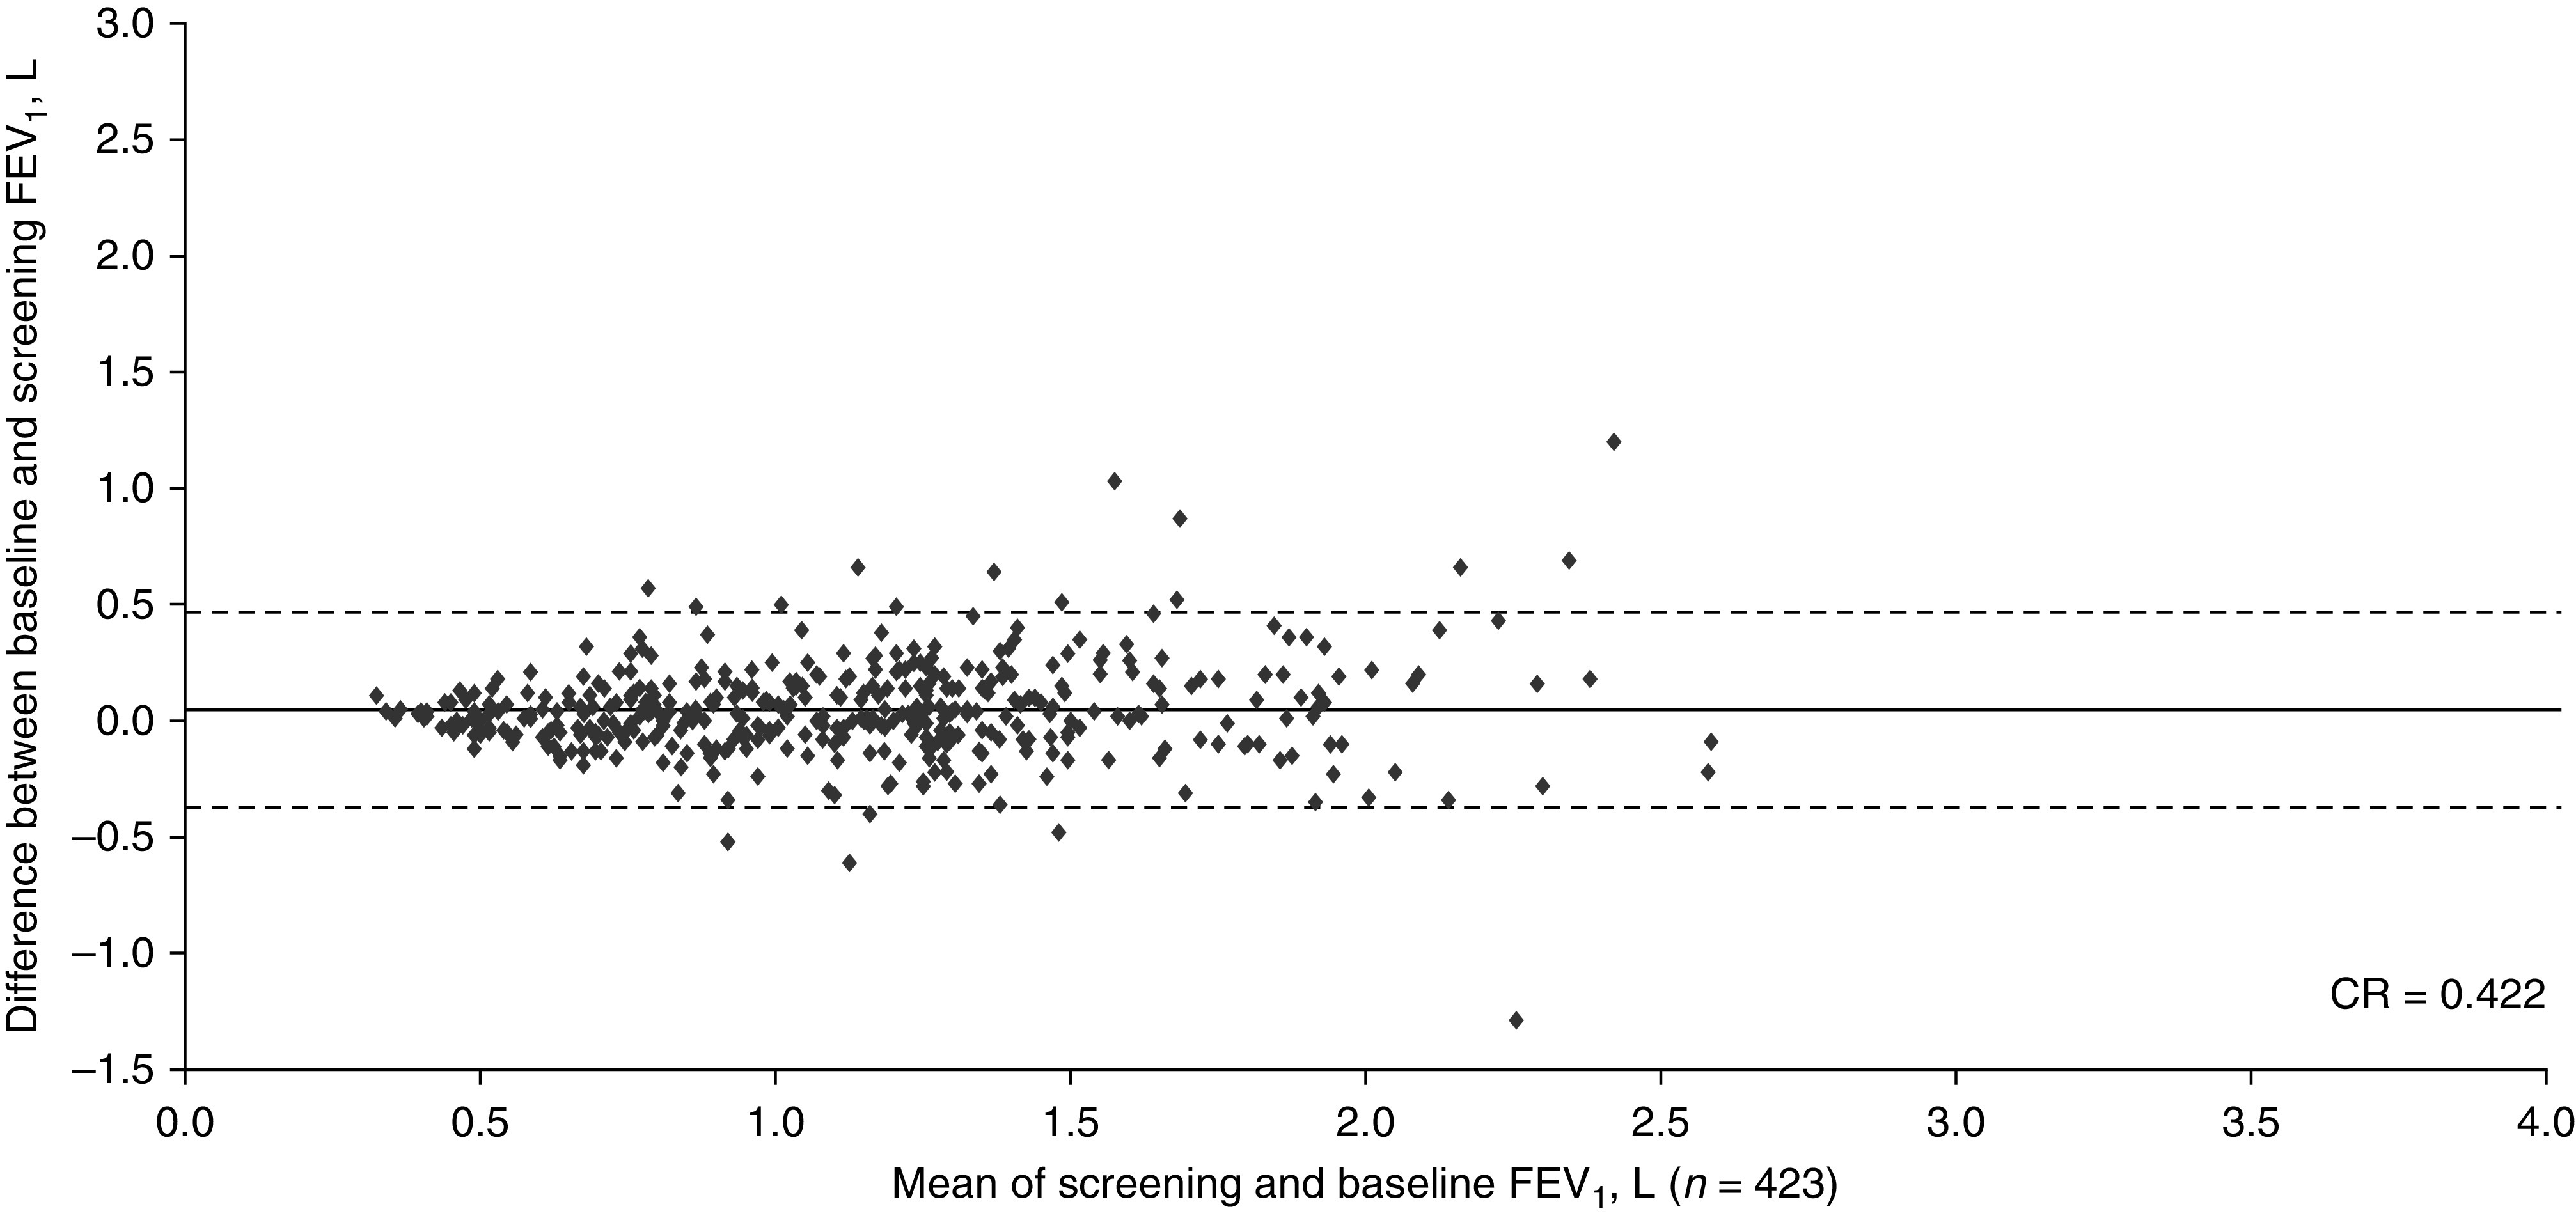
Figure 2.

Bland-Altman plot depicting the reproducibility between the screening values and measurements at 4 weeks (baseline) for FEV1 from study HZC102871 in subjects with COPD (ClinicalTrials.gov NCT01009463). The central horizontal line shows the mean of differences, and the dashed lines represent the 95% limits of agreement. Of the total N = 427, data were plotted for n = 423 (4 patients had missing data). CR = coefficient of repeatability.
