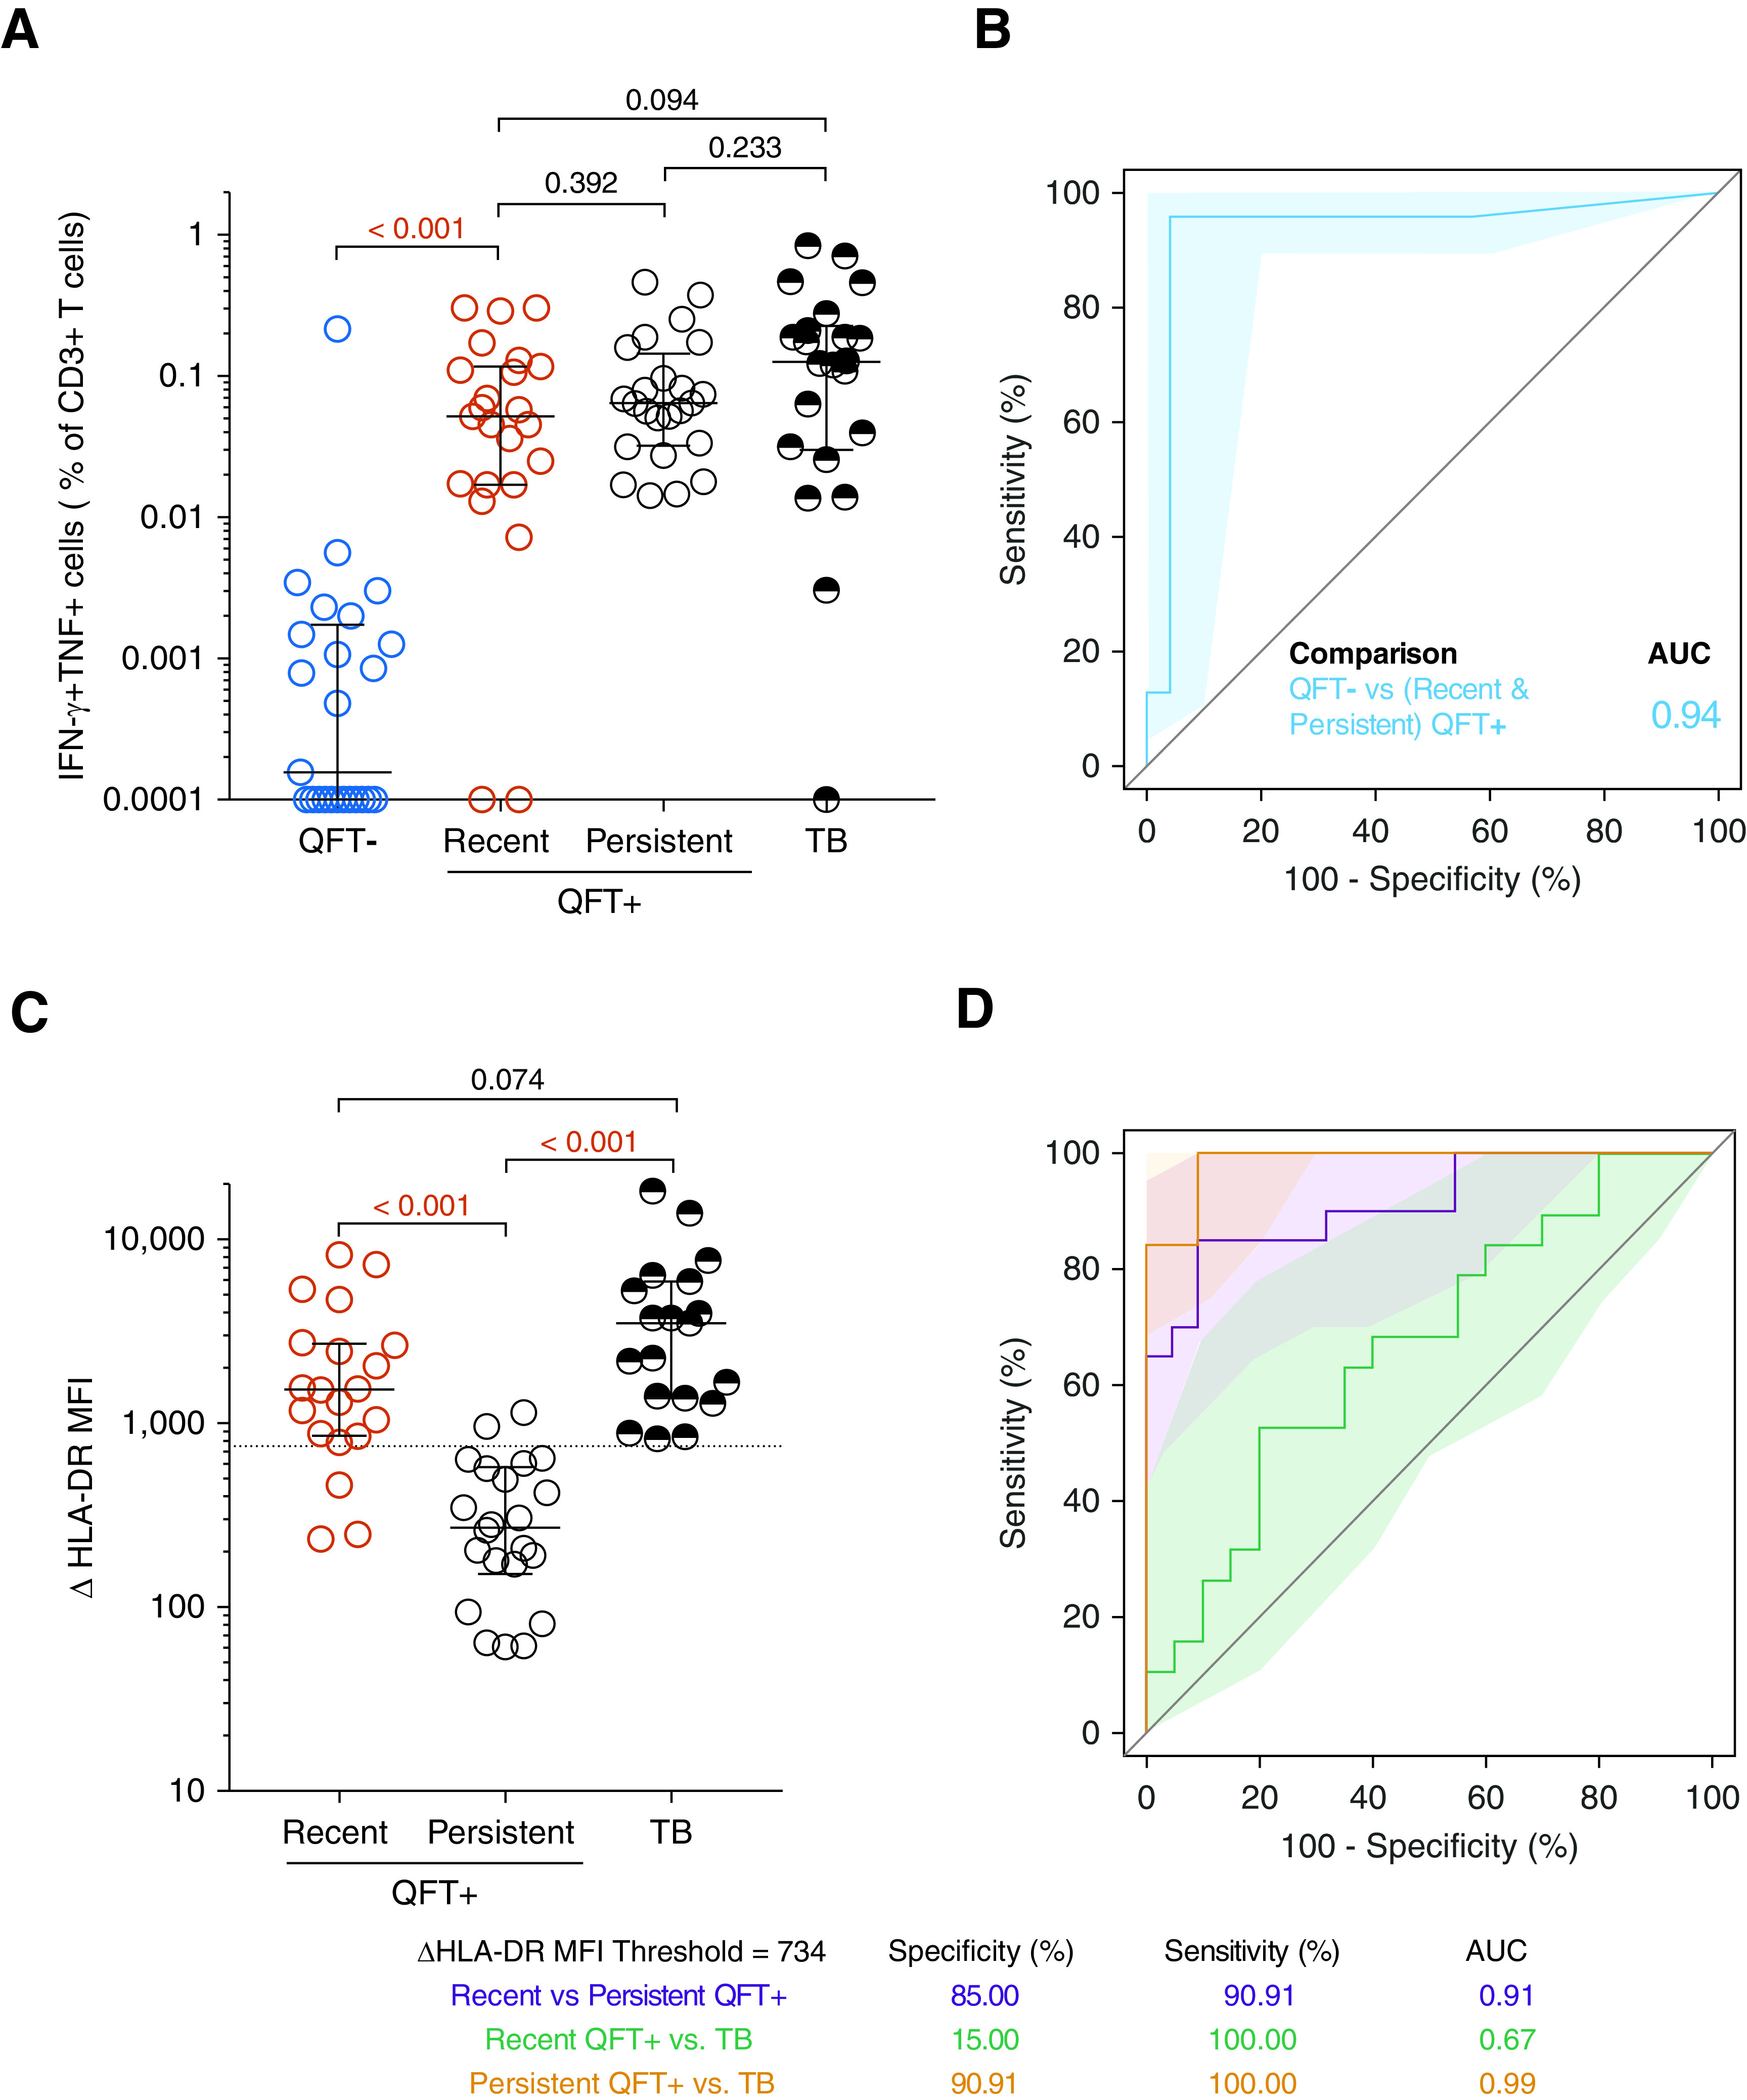
Figure 3.

T-cell activation biomarker can distinguish between recent and persistent QuantiFERON-TB Gold (QFT)+ individuals as well as between persistent QFT+ individuals and individuals with tuberculosis (TB). (A) Frequencies of background subtracted CFP-10/ESAT-6–specific IFN-γ+ TNF+ CD3+ T cells detected before (QFT−; blue; n = 25) and after (recent QFT+; red; n = 23) QFT conversion, during persistent QFT+ (black open symbols, n = 24), and in patients with TB (black half-filled symbols; n = 22) in the test cohort. (B) Area under the receiver operating characteristic curve (AUROC) analysis illustrating the performance of CFP-10/ESAT-6–specific IFN-γ+ TNF+ CD3+ T cells to distinguish between samples taken before (QFT−) and after QFT conversion (recent or persistent QFT+ combined). (C) ΔHLA-DR median fluorescent intensity (MFI) in responders with recent QFT+ conversion (n = 20), persistent QFT+ results (n = 22), or TB (n = 19). (D) AUROC analysis depicting the performance of ΔHLA-DR MFI to discriminate between recent and persistent QFT+, between recent QFT+ and TB and between persistent QFT+ and TB. P values were calculated using the Wilcoxon signed-rank test for paired (QFT− vs. recent QFT+) or the Mann-Whitney U test for unpaired (all other) comparisons. Where appropriate, we corrected for multiple comparisons as described in the Methods. P values highlighted in red are considered significant. Shaded areas in AUROC plots depict 95% confidence intervals. Values <0.0001 were set to 0.0001 to allow display on a logarithmic scale. AUC = area under the curve.
