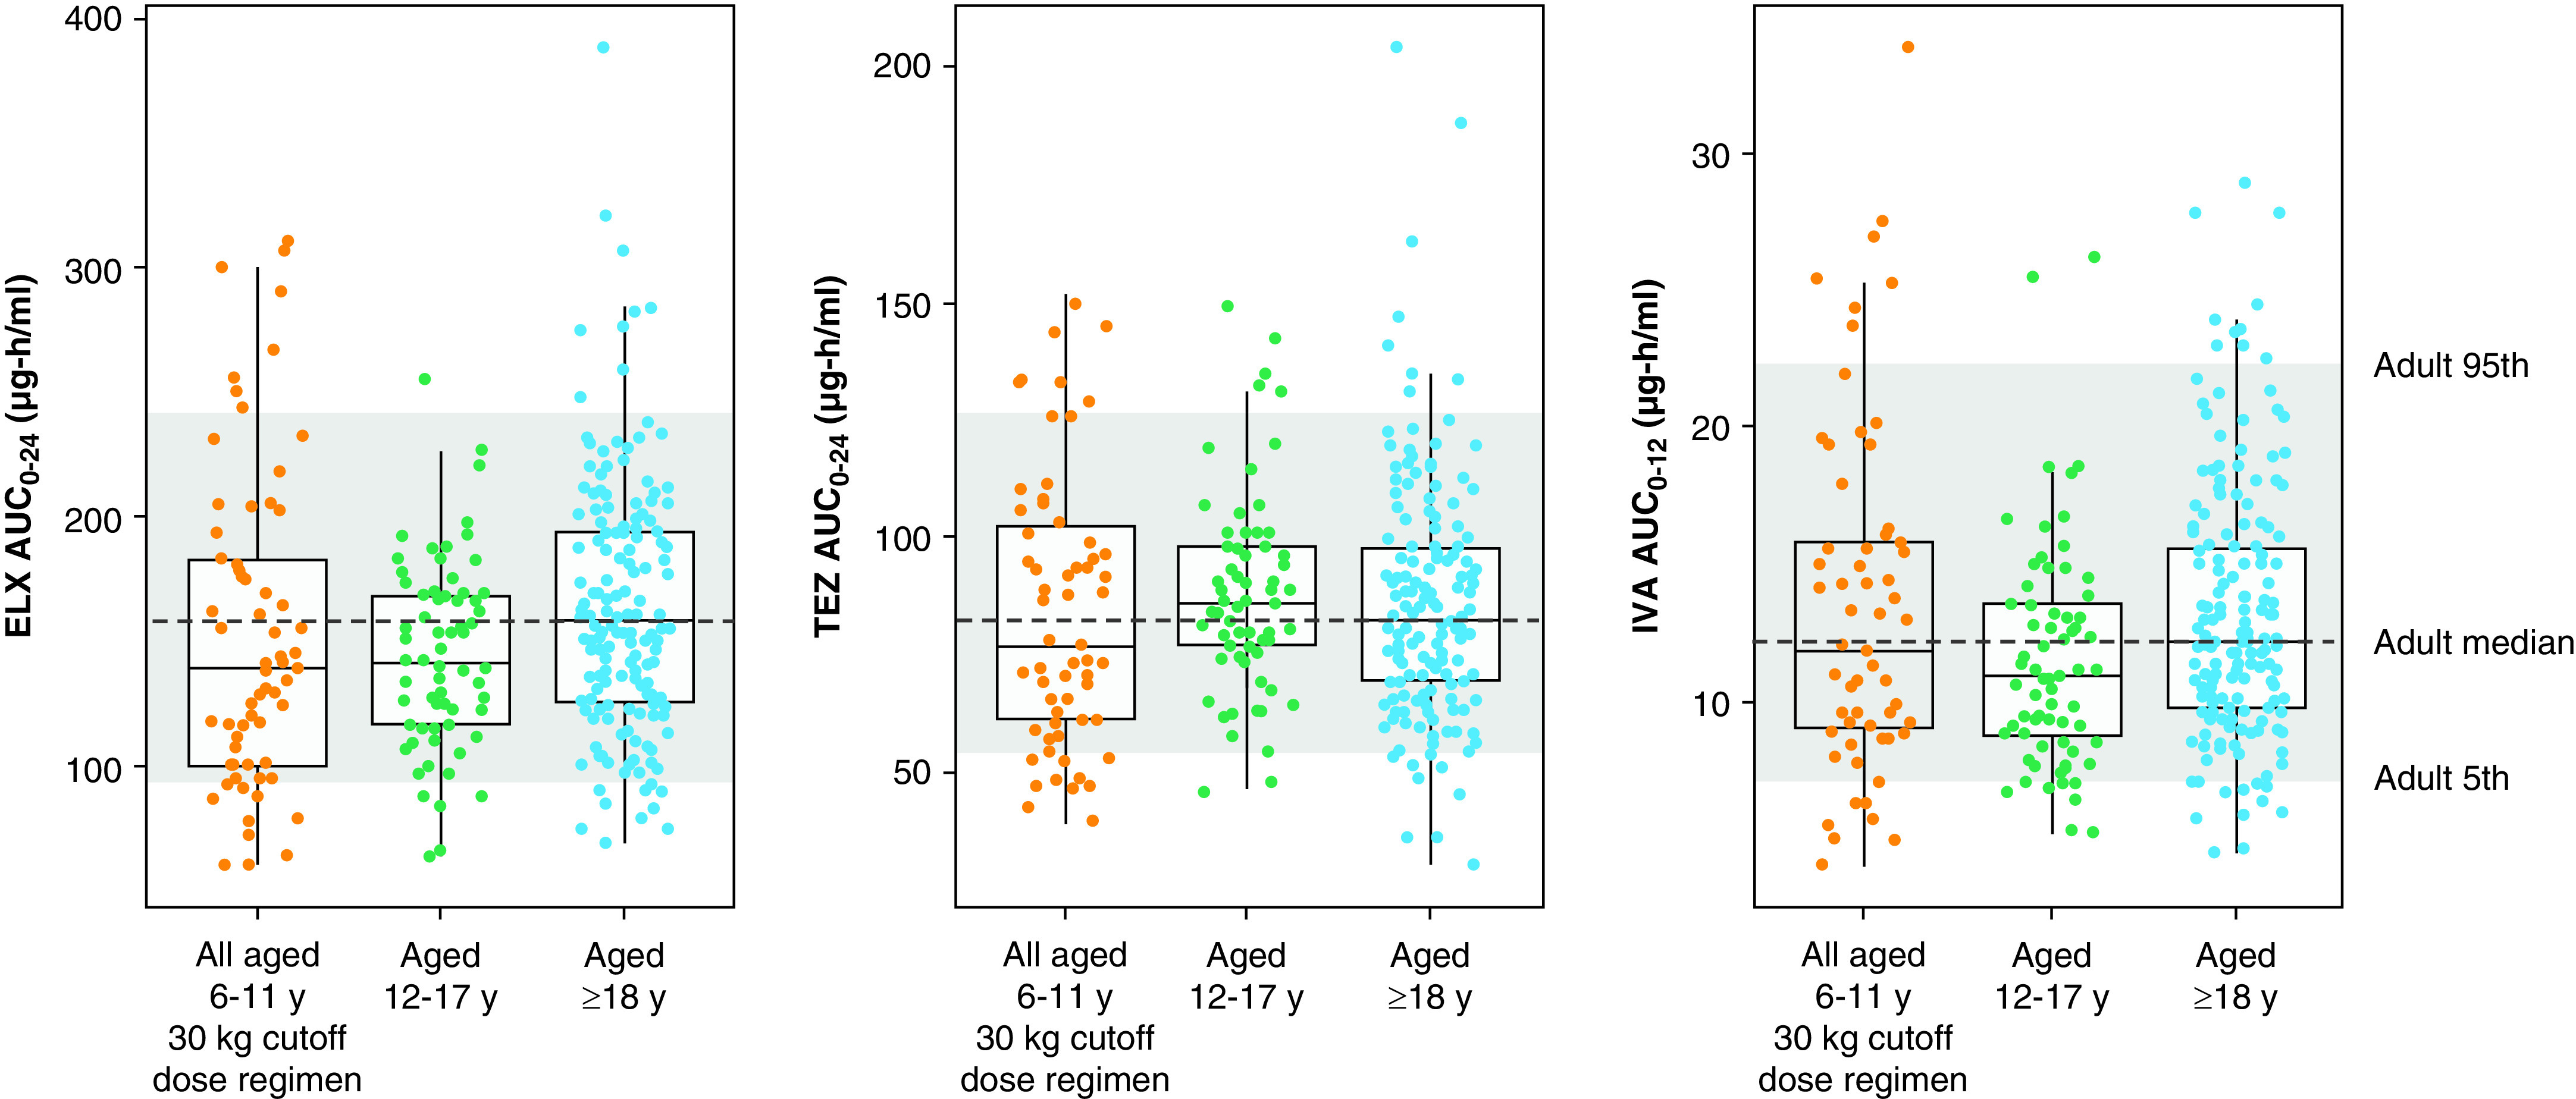
Figure 2.

Pharmacokinetic exposure simulation. For each boxplot, the median is represented by a horizontal line, and the interquartile range is represented by the box. The whiskers mark the largest and smallest values within 1.5 × interquartile range. Dots represent individual empirical Bayes AUC estimate (EBE) values. In each panel, the dashed horizontal line represents the median of the ⩾18 years AUC values, and the gray shaded area indicates the 5th and 95th percentiles of the ⩾18 years AUC values. The EBE values for 6–11 years are from part B of this study. The EBE values for ⩾12 years are from studies 445-102 and 445-103 (12, 13). AUC = area under the concentration-versus-time curve; AUC0–12 = area under the concentration-versus-time curve (0–12 h after dose); AUC0–24 = area under the concentration-versus-time curve (0–24 h after dose); ELX = elexacaftor; IVA = ivacaftor; TEZ = tezacaftor.
