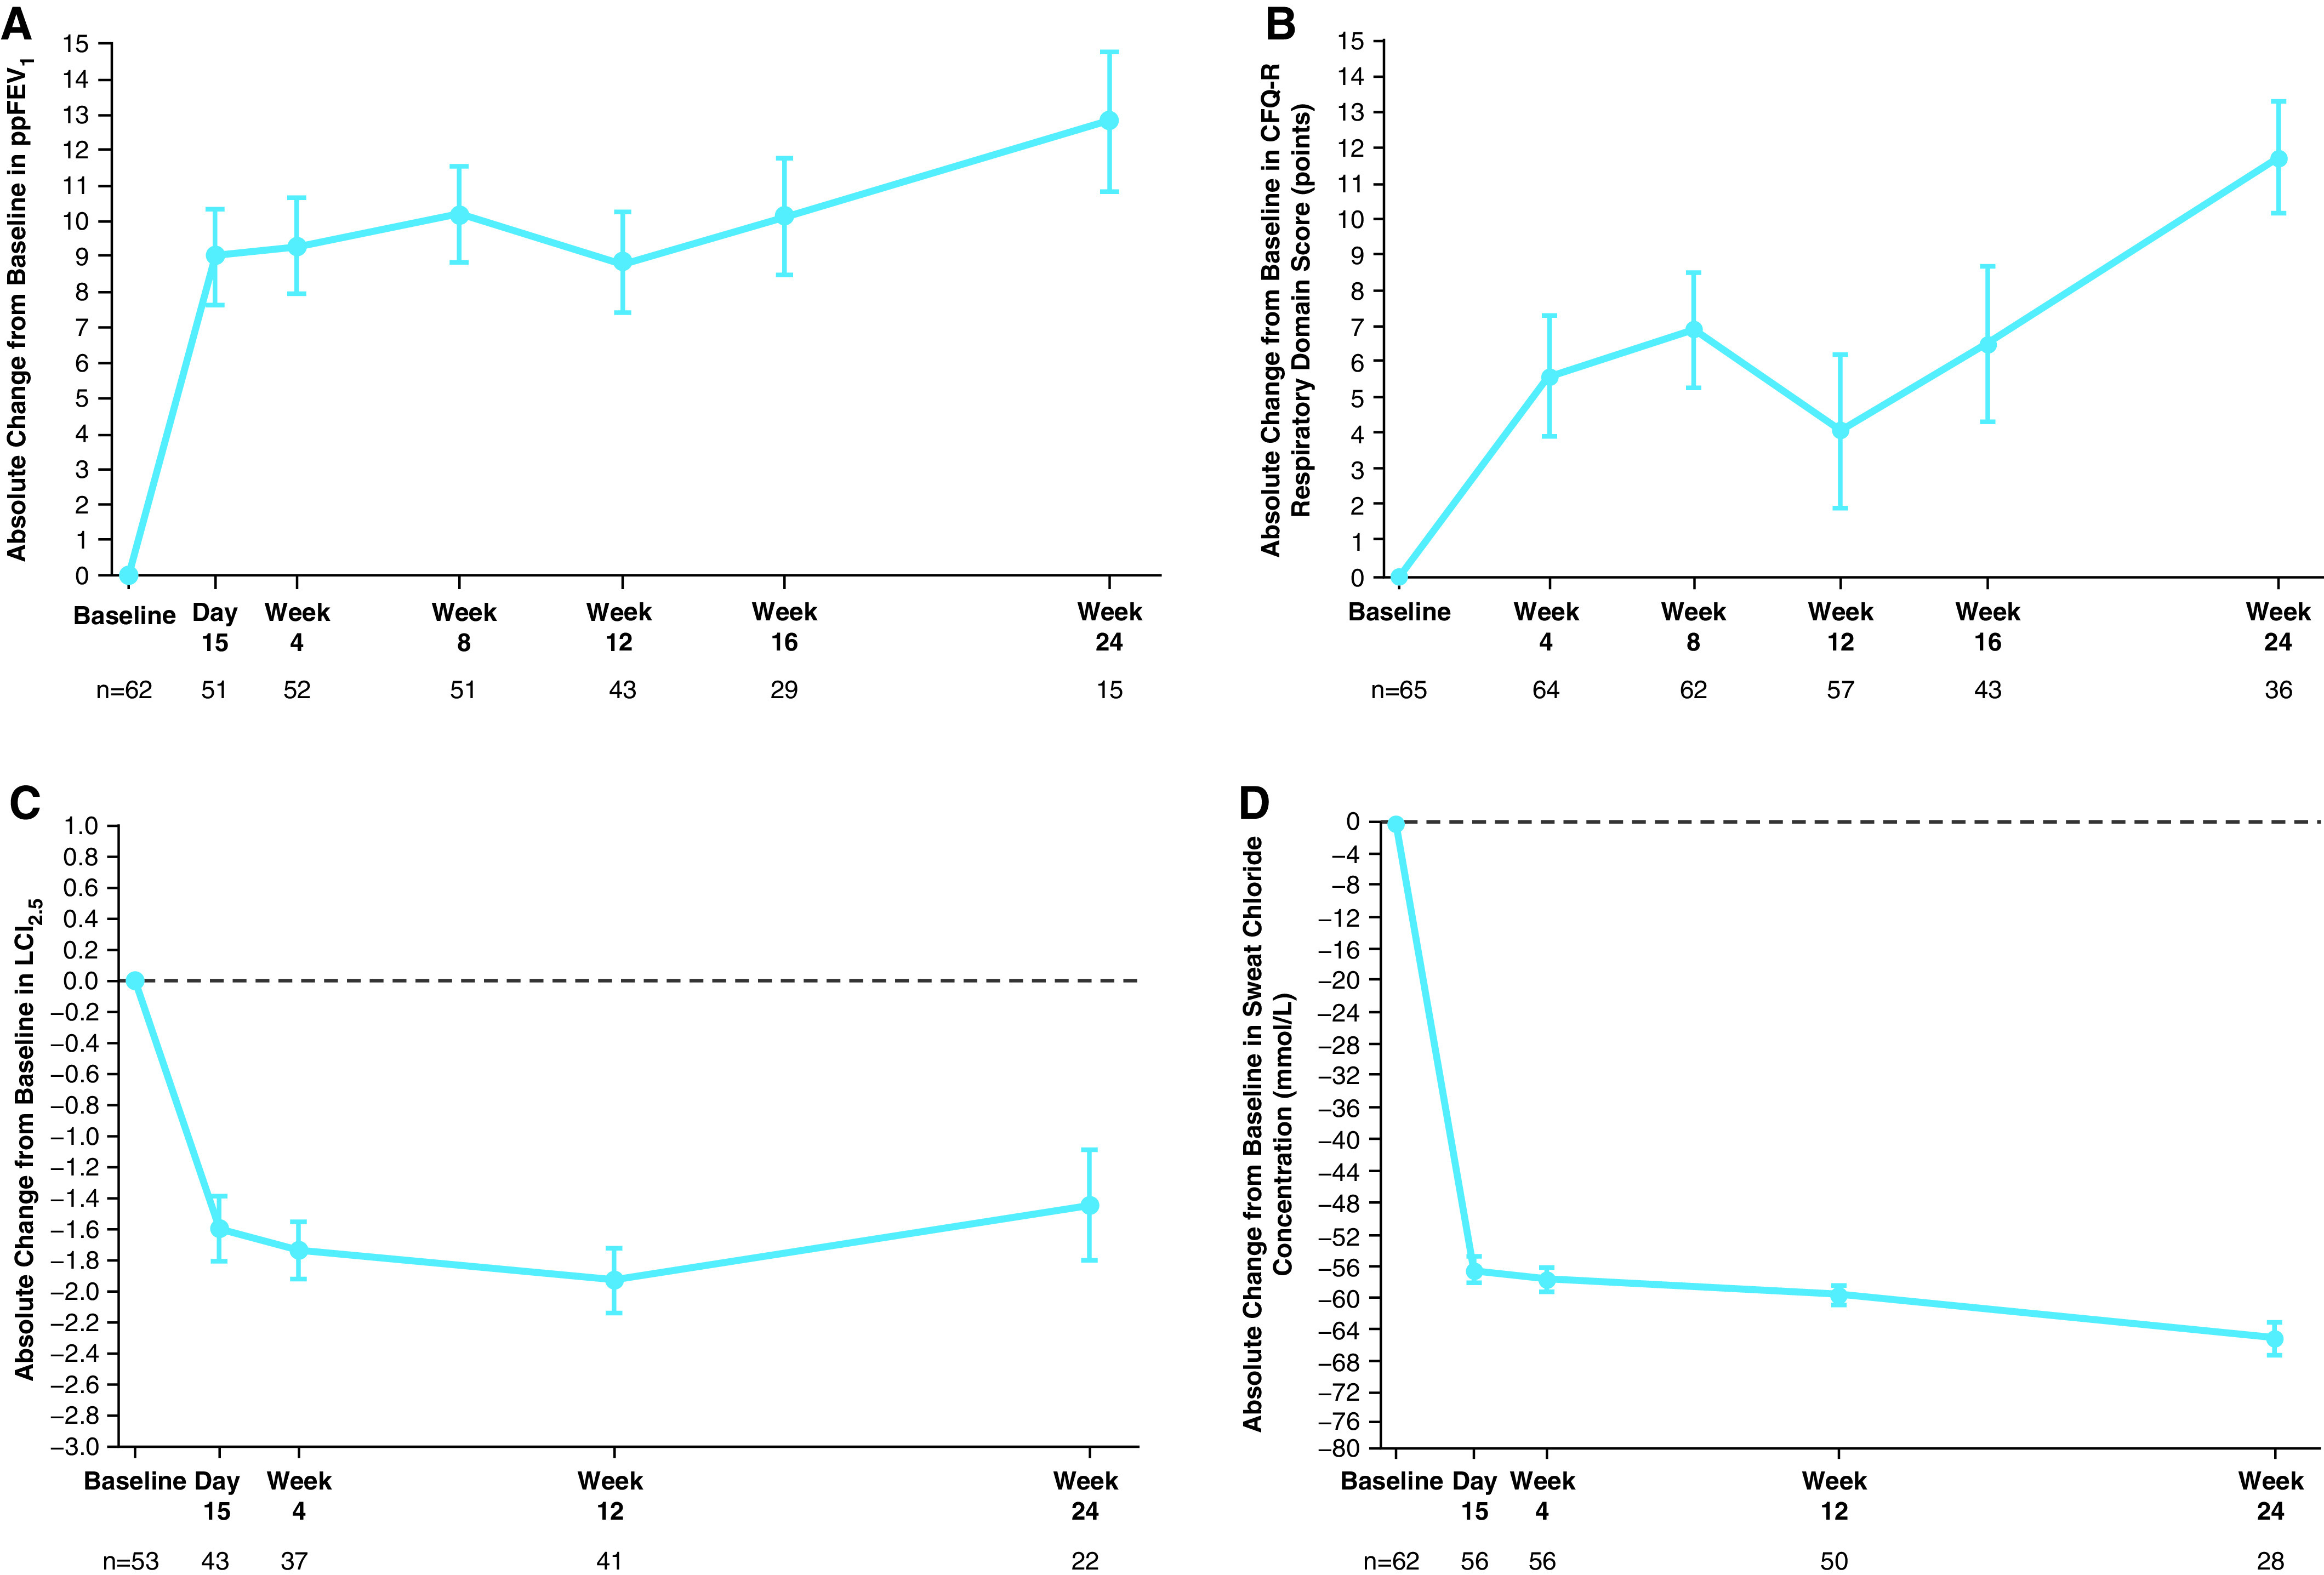
Figure 3.

Efficacy results, by visit, in part B. (A) Absolute change from baseline at each visit in ppFEV1. (B) Absolute change from baseline at each visit in the respiratory domain score on the CFQ-R, child’s version; scores are normalized to a 100-point range, with higher scores indicating a higher patient-reported quality of life with regard to respiratory symptoms. (C) Absolute change from baseline at each visit in LCI2.5. (D) Absolute change from baseline at each visit in sweat chloride concentration; a reduction indicates improvement in CFTR (cystic fibrosis transmembrane conductance regulator) function. Data are least squares means based on a mixed-effects model for repeated measures, and error bars indicate SEMs; the dashed line indicates no change from baseline. Sample size shown under each x-axis is the number of patients at the time point with evaluable in-clinic data. CFQ-R = Cystic Fibrosis Questionnaire–Revised; LCI2.5 = lung clearance index2.5; ppFEV1 = percentage of predicted FEV1.
