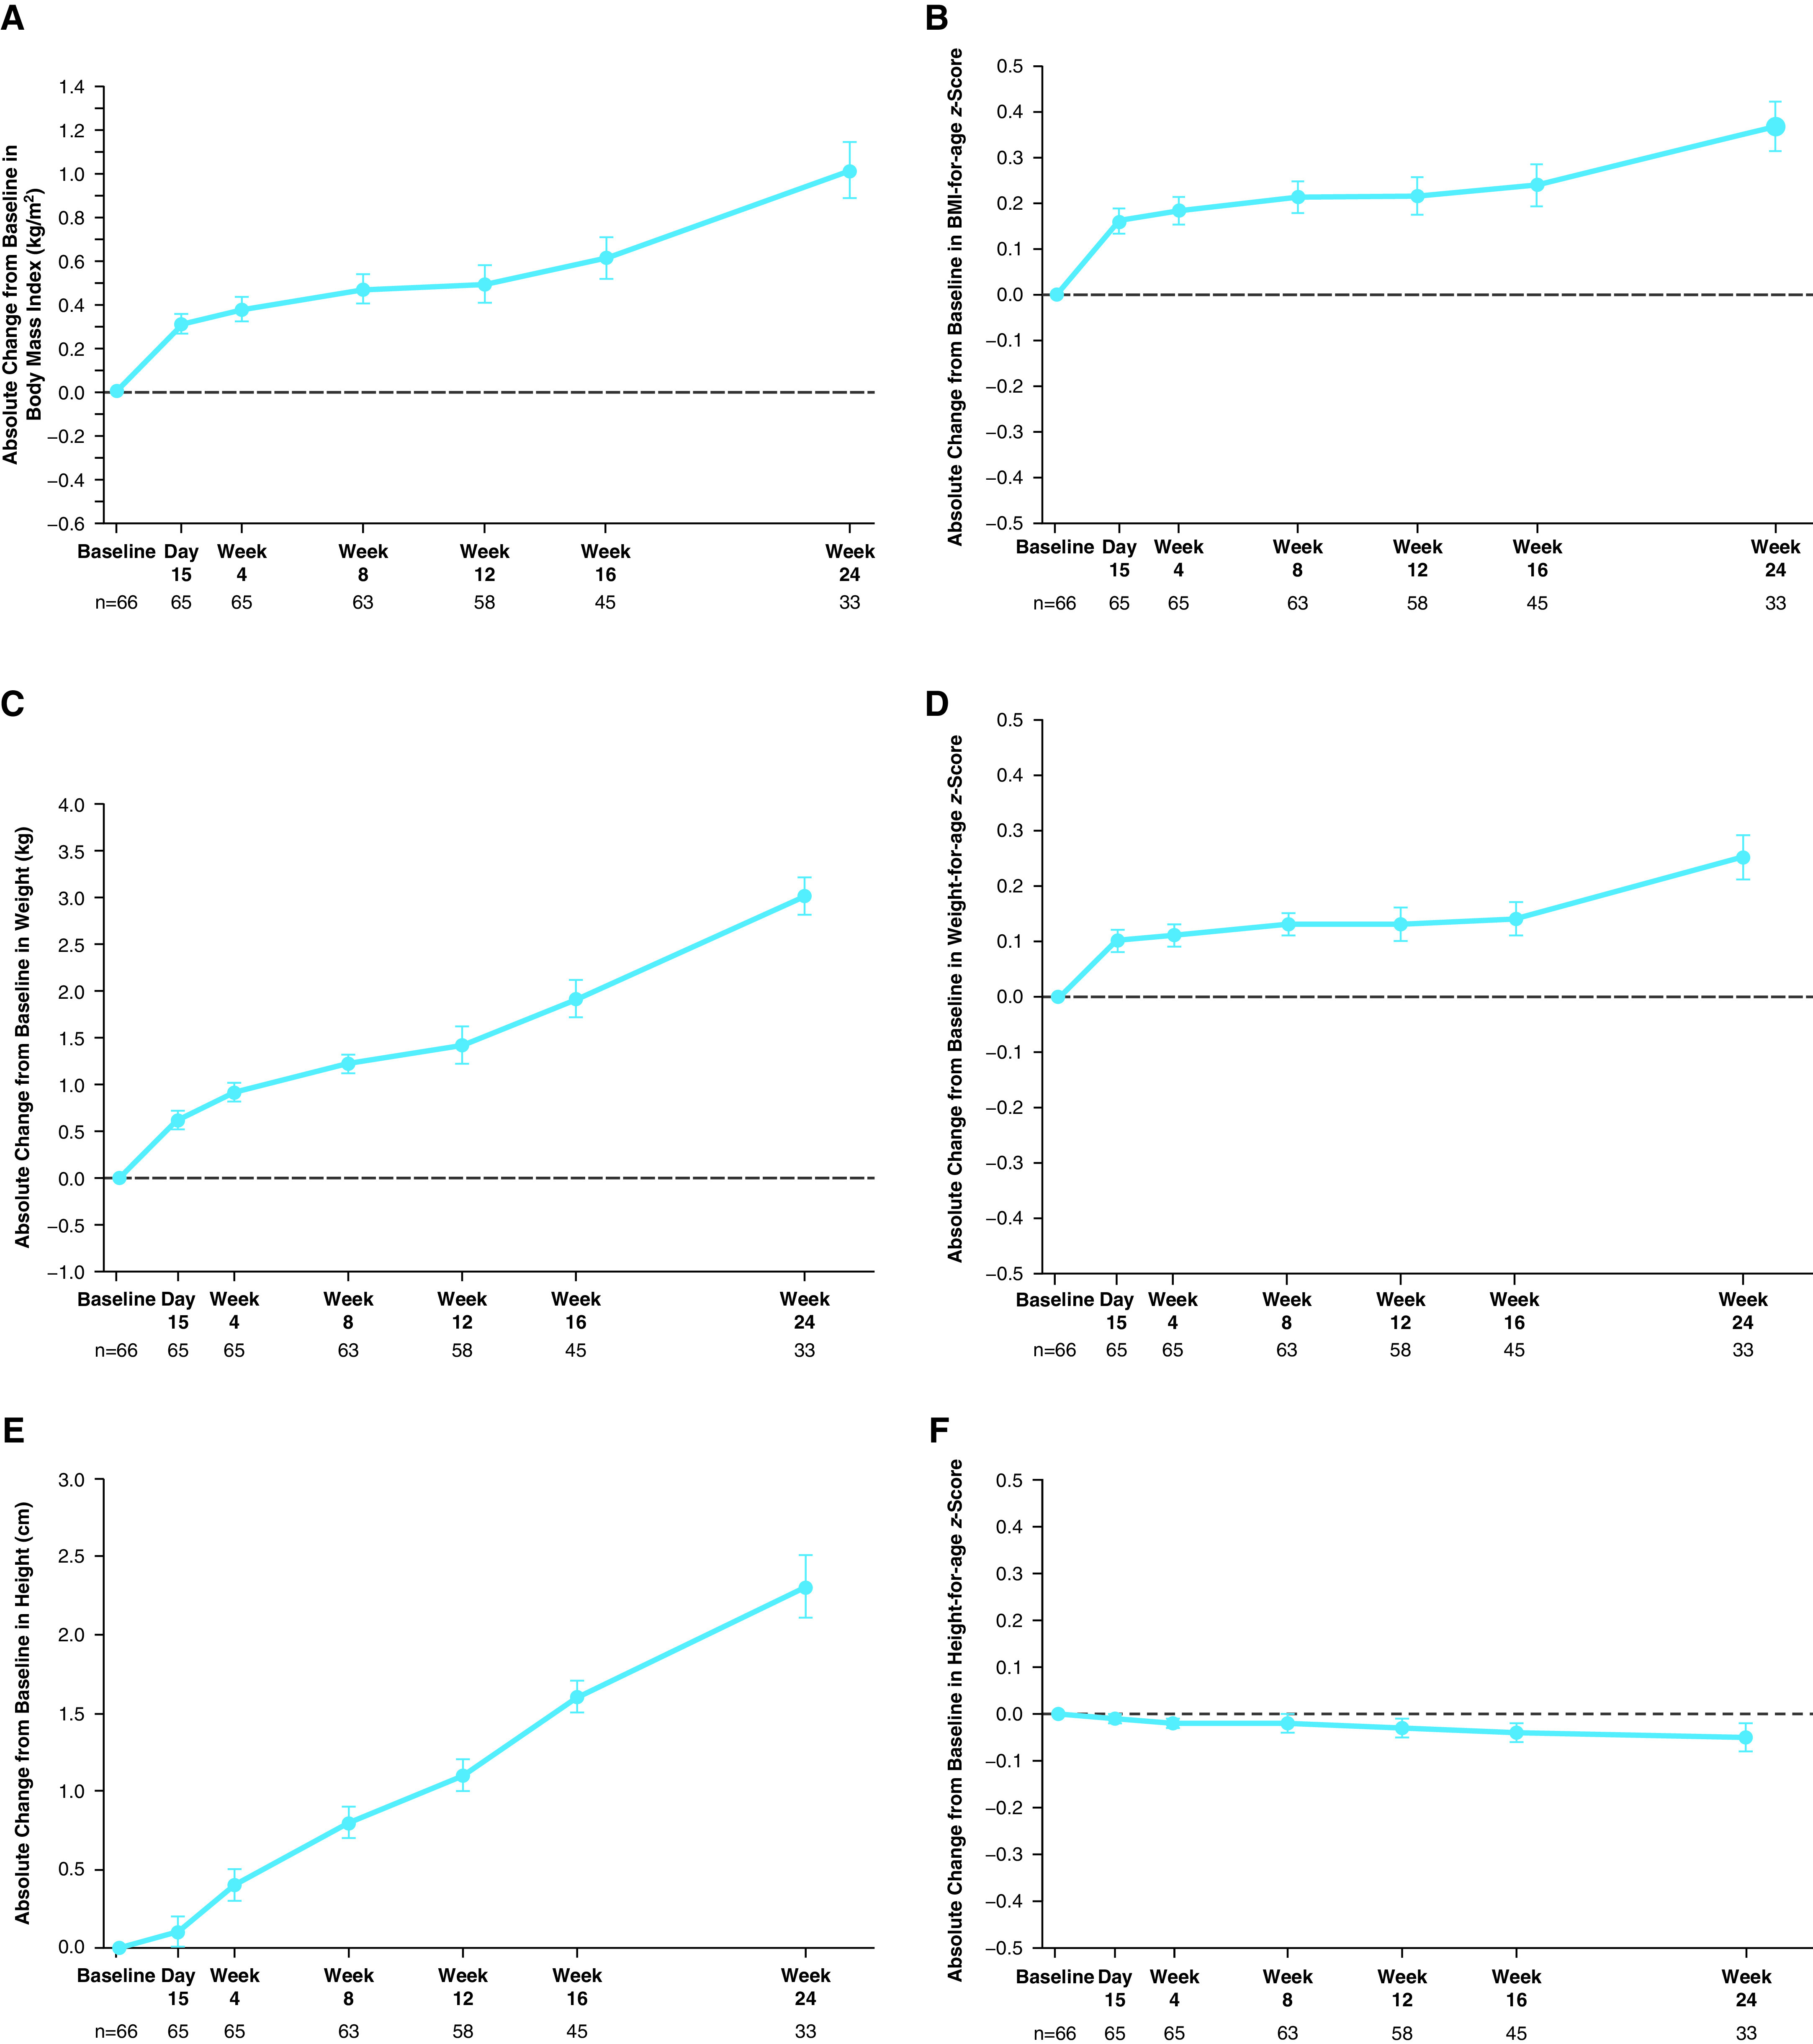
Figure 4.

Absolute change from baseline at each visit in (A) BMI, (B) BMI-for-age z-score, (C) weight, (D) weight-for-age z-score, (E) height, and (F) height-for-age z-score in part B. Data are least squares means based on a mixed-effects model for repeated measures, and error bars indicate SEMs; the dashed line indicates no change from baseline. Sample size shown under each x-axis is the number of patients at the time point with evaluable in-clinic data. BMI = body mass index.
