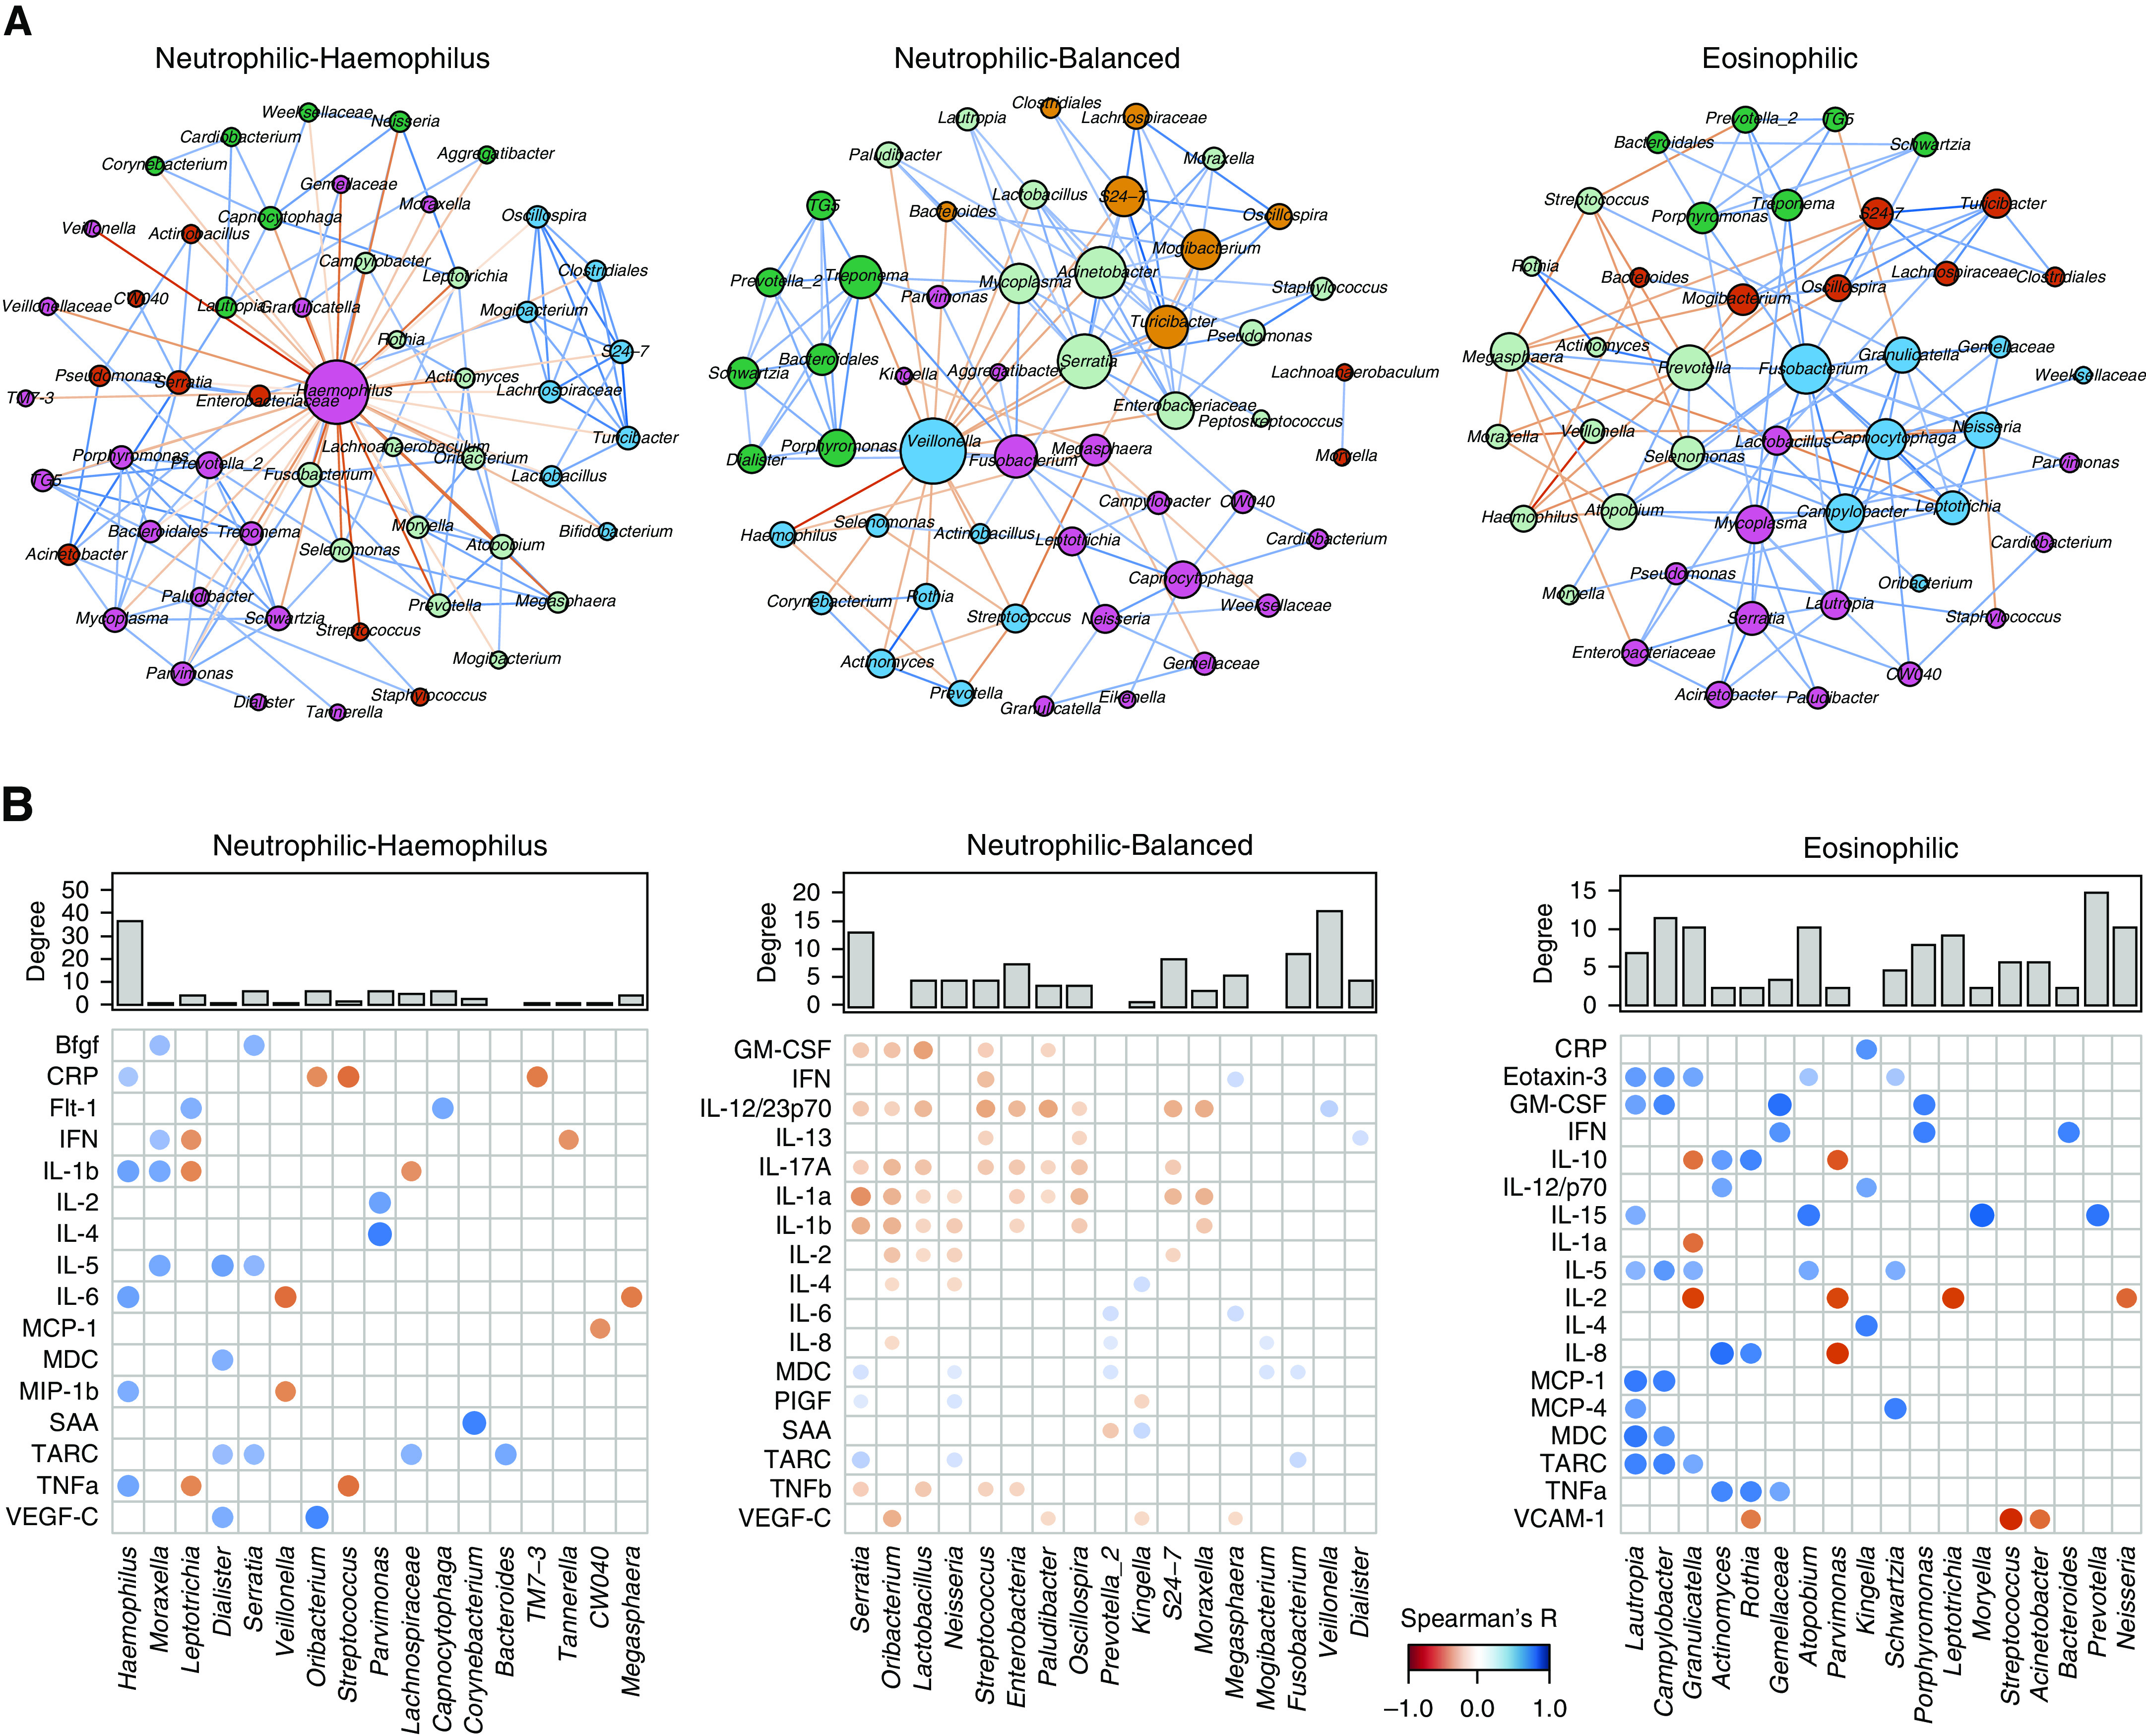
Figure 5.

Distinct host–microbiome interactions between inflammatory subtypes. (A) The microbiome cooccurrence network for significant correlations between microbiome genera identified by SparCC (Sparse Correlations for Compositional data) in the COPDMAP (Chronic Obstructive Pulmonary Disease [COPD] Medical Research Council/Association of the British Pharmaceutical Industry) and AERIS (Acute Exacerbation and Respiratory Infections in COPD) cohorts. Each node represents a genus. The size of the node is proportional to its degree of connectivity. Nodes were colored by their module assignments by the “Modularity” function on the basis of a Louvain community-detection algorithm implemented in Gephi software (resolution = 1.0). Each edge represents a significant correlation between pairs of nodes (false discovery rate P < 0.05). The width of the edge is proportional to the absolute correlation coefficient. Edges were colored on the basis of coexclusion (red) or cooccurrence (blue) relationship. The top 100 positive and negative correlations are shown for display purposes. (B) Significant correlations between microbiome genera and sputum mediators using residualized all-against-all correlation by using HAllA (Hierarchical All-against-All association testing) in COPDMAP data. Each dot represents a significant correlation between a microbiome genus and a sputum mediator (false discovery rate P < 0.1). The size and color strength of the dot are proportional to the Spearman correlation coefficient. Dots were colored on the basis of negative (red) or positive (blue) correlation. The top 20 positive and negative correlations are shown for display purposes. The degree of connectivity for each genus in the microbiome cooccurrence network (in A) was indicated above the microbiome–mediator correlation matrix. SAA = serum amyloid A.
