
Figure 11. Barnes Maze Search Strategy for MAPT:Reelin cKO cohort.
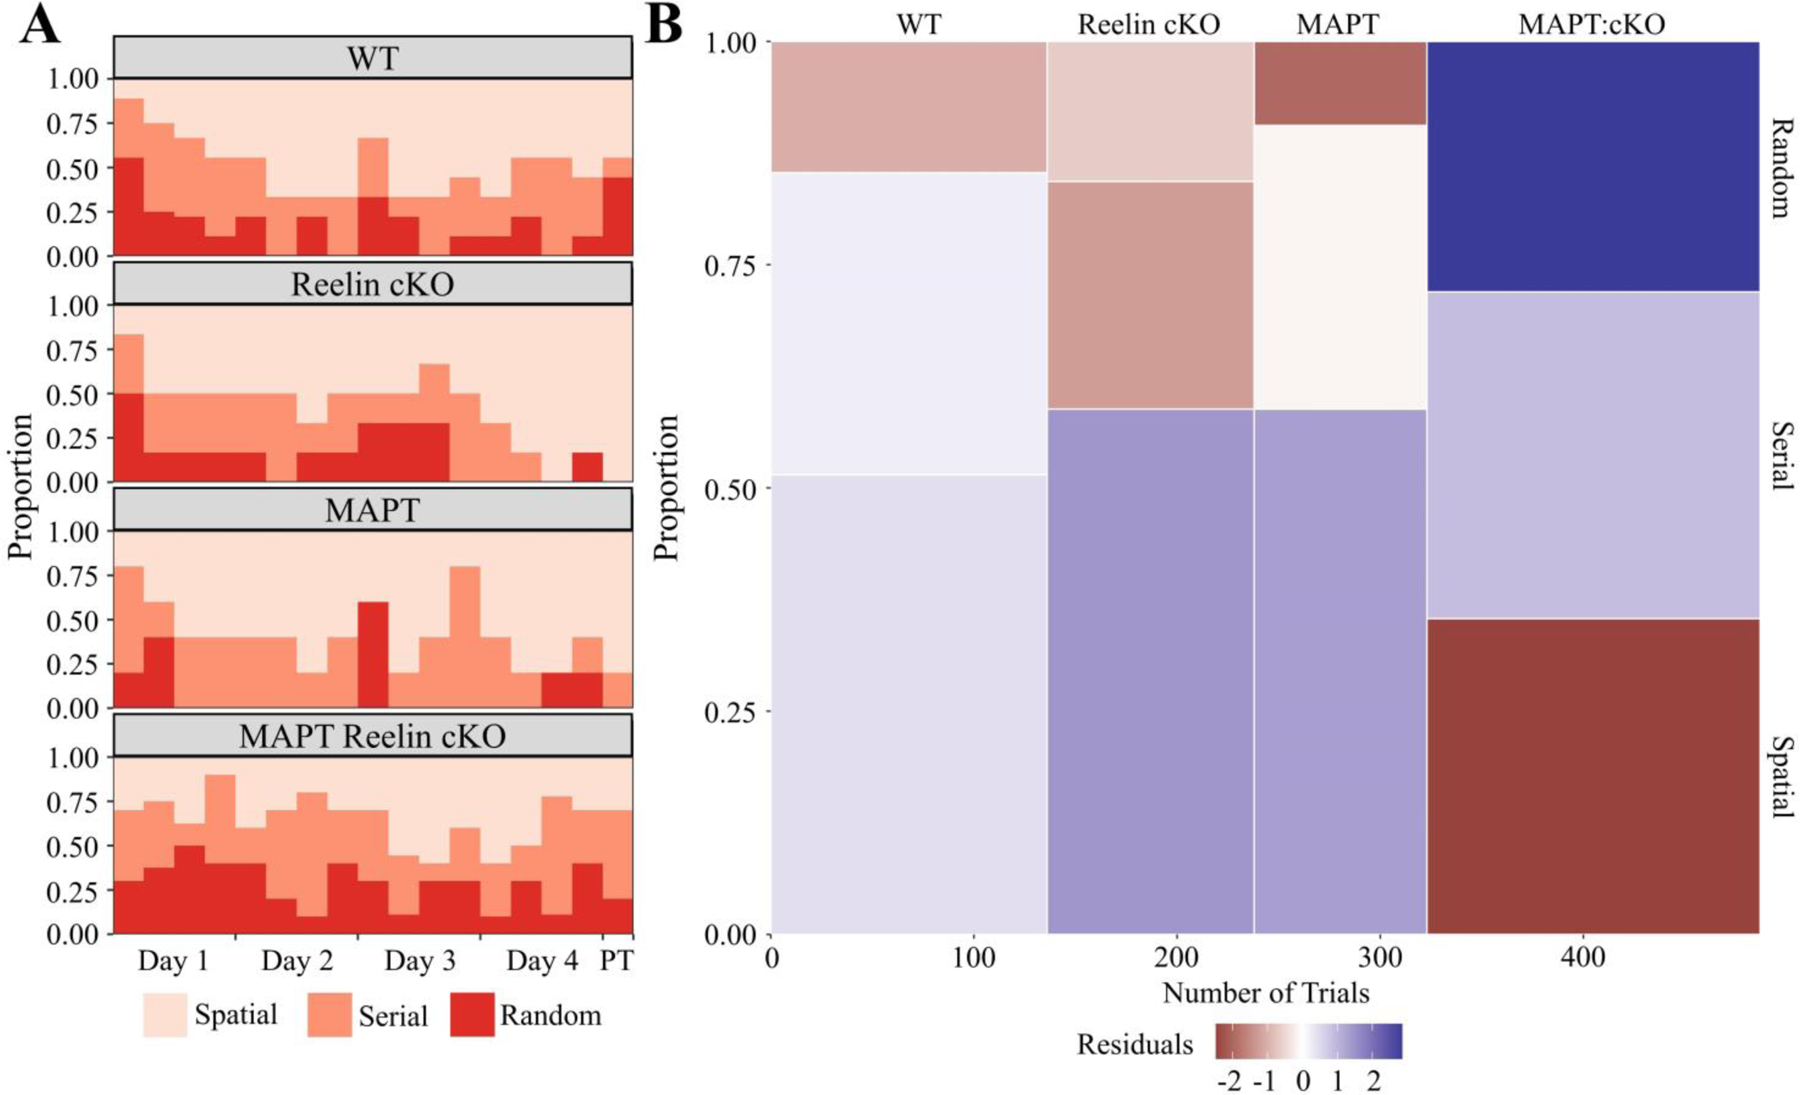
A) Relative probability diagram illustrating the proportion of animals utilizing search strategy during each trial except the initial training trial. A significant relationship was found (Kruskal-Wallis rank sum test; χ2(3) = 23.748, p < 0.0001). B) Mosaic plot visually representing χ2 test between search strategy and genotype. A significant relationship was found between genotype and search strategy (Pearson’s χ2; χ2(6, N = 493) = 25.943, p = 0.0002). The height of each bin shows cumulative proportion each genotype utilized a search strategy. The width of each bin is indicative of the number of trials used to calculate the proportion. Relative over/under-representation of a search strategy represented by continuous color scale plotting the residuals of the χ2 test. The initial training trial was excluded from this calculation. All animals were 36±2week-old males. (WT: n = 8; Reelin cKO: n = 6; MAPT: n = 5; MAPT Reelin cKO: n = 9). Abbreviations: PT - probe trial.