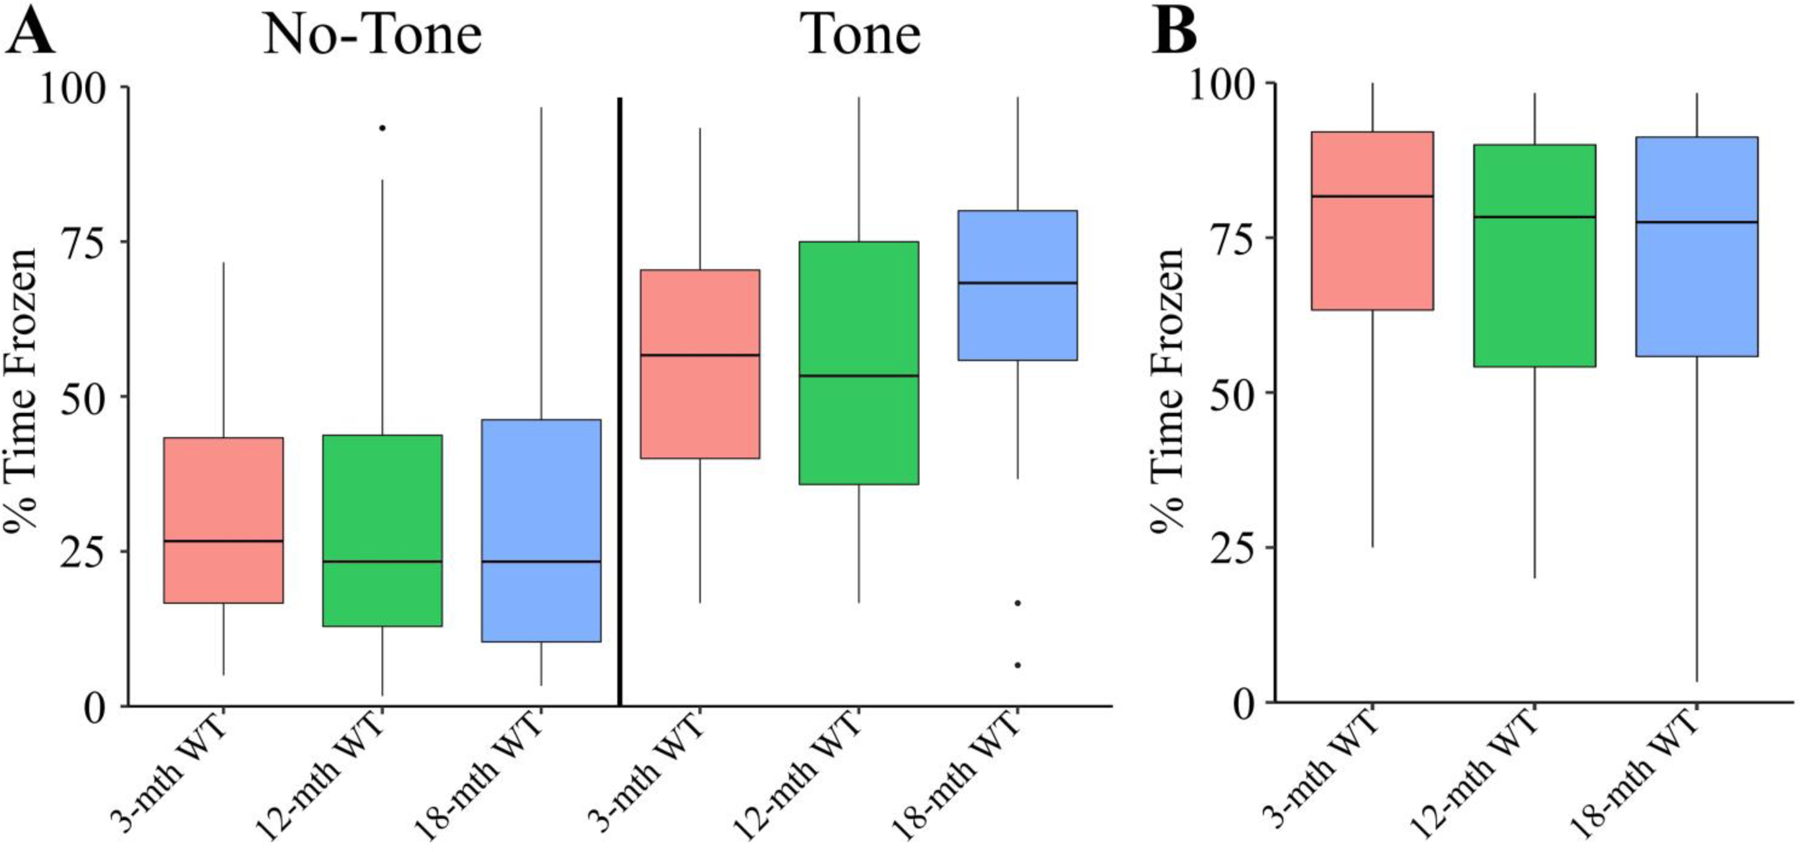
Figure 4. Aged WT Trace Cumulative Fear Conditioning Time Frozen Measurements.

In all panels color is indicative of age (3-mth WT: pink, 12-mth WT: green, 18-mth WT: blue). A) The boxplot for the percent of time frozen during minutes either in the absence of the tone (left) or containing the tone (right). There were no significant differences detected between groups (Kruskal-Wallis rank sum test; χ2(2) = .5322, p = 0.7664). B) The boxplot for the percent of time frozen during the entire context trial. No significant differences were detected in the context test (Kruskal-Wallis rank sum test; χ2(2) = 1.571, p = 0.456. For TFC longitudinal data, see (Fig. S10). All animals were stated age±2wk males (3-mth WT: n = 12; 12-mth WT: n = 12; 18-mth WT: n = 10).
