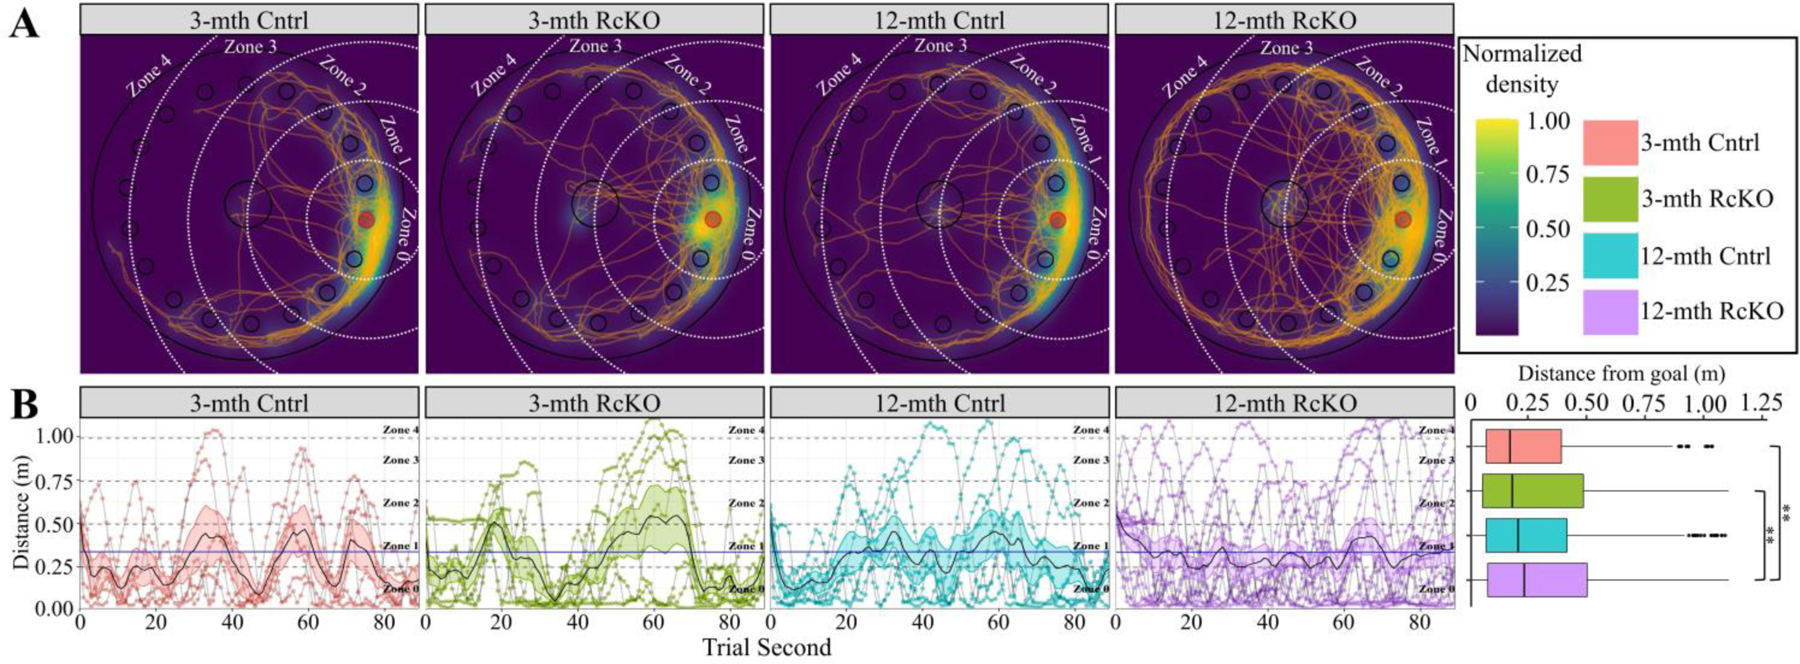
Figure 6. Barnes Maze Extinction and Retention for Reelin cKO cohort.

In all panels color is indicative of age and genotype (3-mth Cntrl: pink, 3-mth RcKO: green, 12-mth Cntrl: blue, 12-mth RcKO: violet). A) Choropleth, cartesian positional measurements normalized to the amount of time the position was occupied and overlaid upon a schematic of the apparatus. White dashed arcs: zone boundaries. Orange lines: path-traces of each mouse during the probe trial. B) Distance of each mouse from the goal location during each second of the probe trial. Grey lines connect consecutive measurements for each mouse. Zone occupancy shown via dashed lines. Solid black line with colored ribbon: mean ± SEM for each second of each genotype/age. Solid blue line: cohort mean (irrespective of genotype or age). The cumulative data displayed in the boxplot shows significant interaction between genotype and distance from the goal (Kruskal-Wallis rank sum test; χ2(3) = 18.081, p = 0.0004). Pairwise comparisons for significance were determined using the Wilcoxon ranked sum test with Benjamini-Hochberg correction and are indicated by: * p < 0.05, ** p < 0.01, *** p < 0.001. (3-mth Cntrl: n = 6; 3-mth RcKO: n = 7; 12-mth Cntrl: n = 7; 12-mth RcKO: n = 14).
