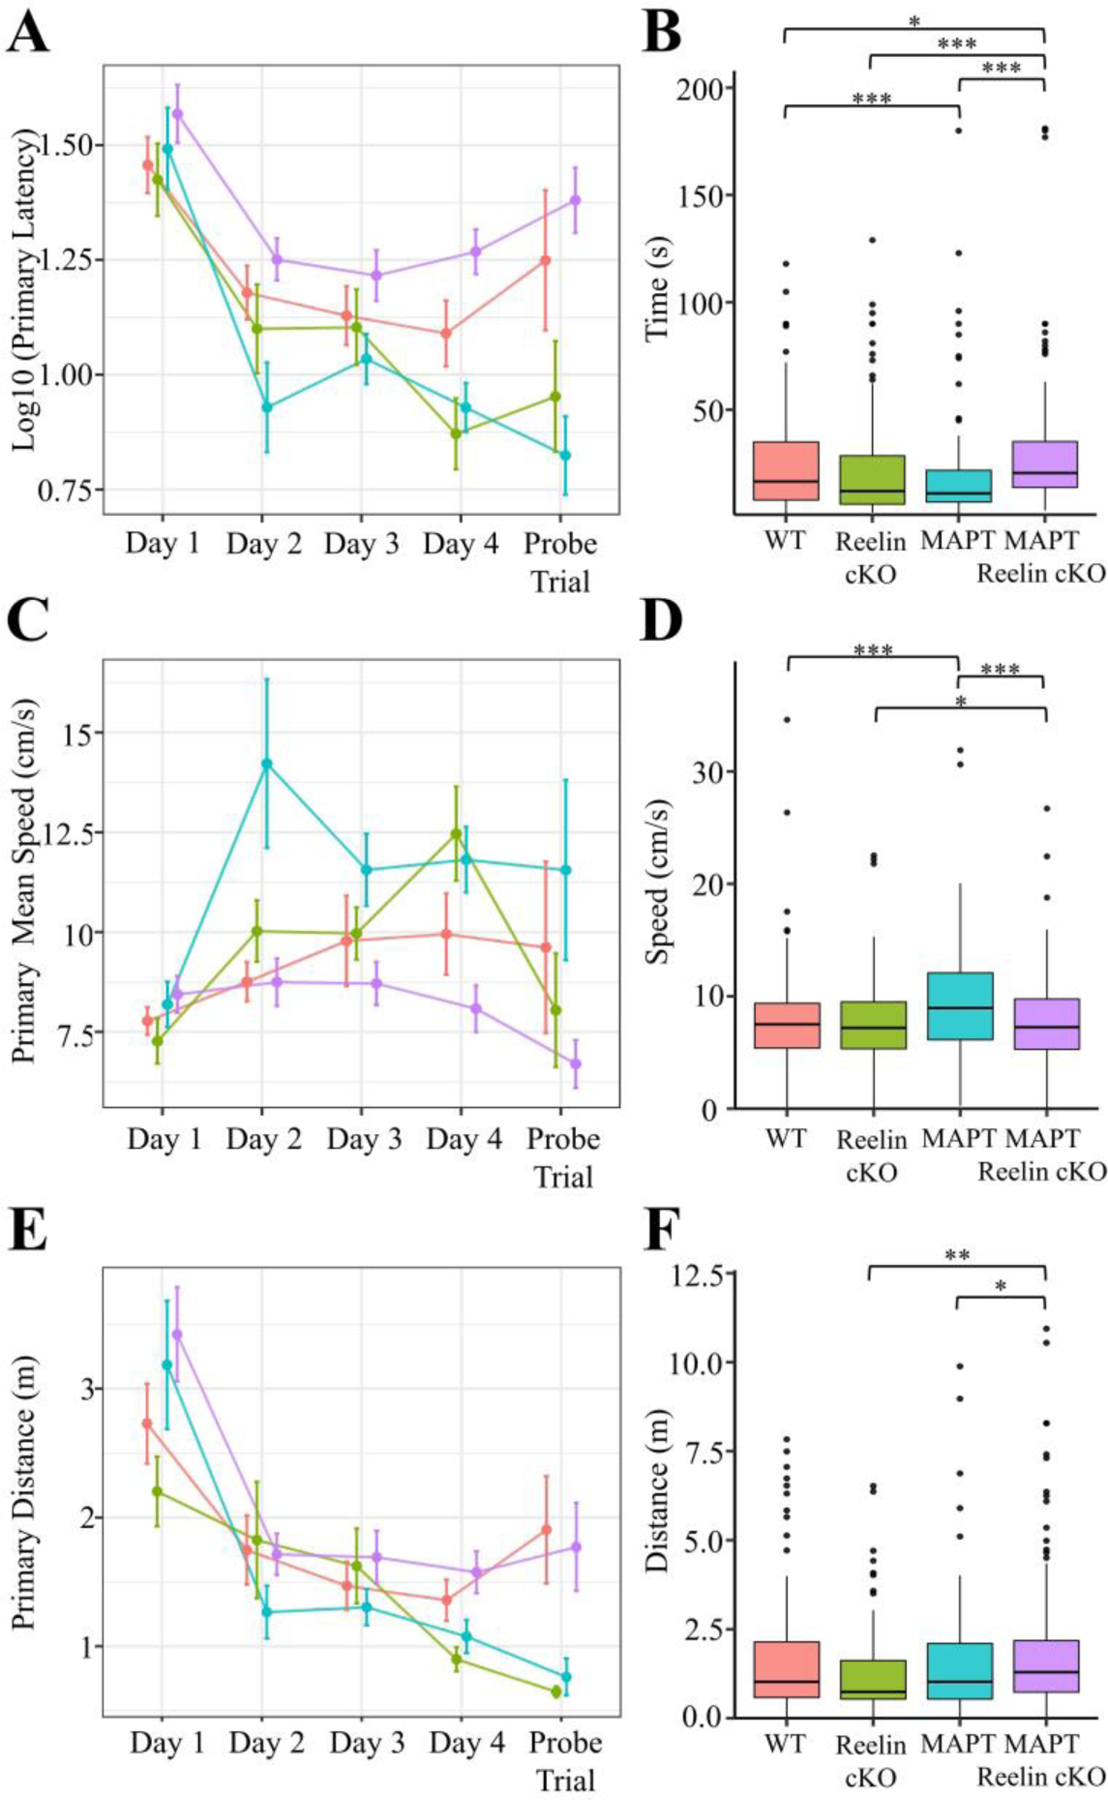
Figure 9. Barnes Maze Primary Acquisition Measures for MAPT:Reelin cKO cohort.

Primary (i.e. time to locate) A-F) measures were calculated for each trial. The mean ± SEM for each day A, C, E) and the boxplot for all trials B, D, F) segregated by genotype is plotted above for latency A-B), mean speed C-D), and distance E-F). In all panels color is indicative of age and genotype (WT: pink, Reelin cKO: green, MAPT: blue, MAPT Reelin cKO: violet). A-B) The primary latency showed a significant interaction with genotype (Kruskal-Wallis rank sum test; χ2(3) = 26.778, p < 0.0001). C-D) The primary mean speed (Kruskal-Wallis rank sum test; χ2(3) = 25.215, p < 0.0001) significantly varied between genotypes. E-F) The primary distance (Kruskal-Wallis rank sum test; χ2(3) = 14.108, p = 0.0028) significantly varied amongst genotypes. Pairwise comparisons for significance were determined using the Wilcoxon ranked sum test with Benjamini-Hochberg correction and are indicated by: * p < 0.05, ** p < 0.01, *** p < 0.001. All animals were 36±2week-old males. (WT: n = 8; Reelin cKO: n = 6; MAPT: n = 5; MAPT Reelin cKO: n = 9).
