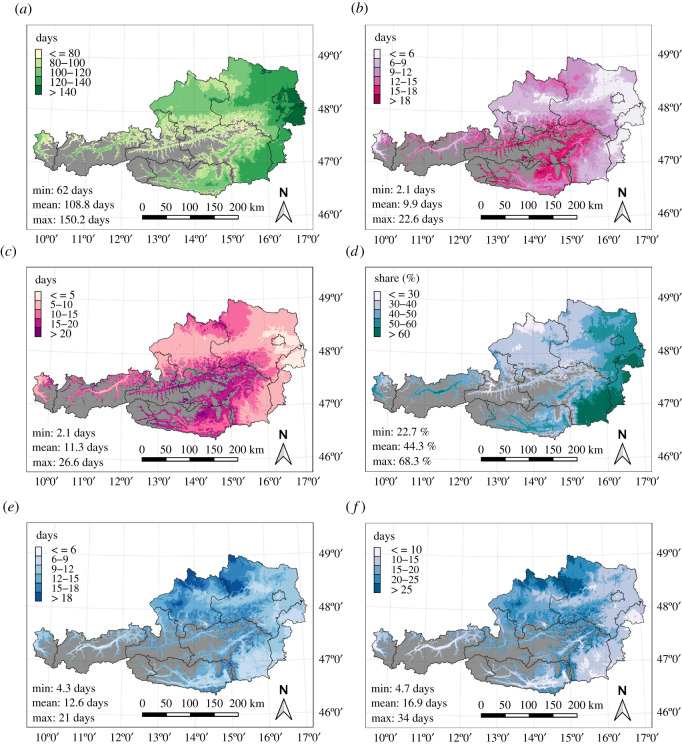
Figure 1.
Climatological means of the period 1981–2010 for the six selected climate indicators. Regions above 1200 m.a.s.l. are masked out (grey colour). (a) Days with optimal flying conditions during the flying season (March–October). (b) The maximum duration of cold spells in late autumn (October–December). (c) Total number of days in late autumn cold spells (October–December). (d) Mild winter weather in January and February (percentage of counted 9-day windows per possible number of 9-day windows). (e) The maximum duration of frost waves in winter (January–March). (f) Total number of days in frost waves in winter (January–March).

