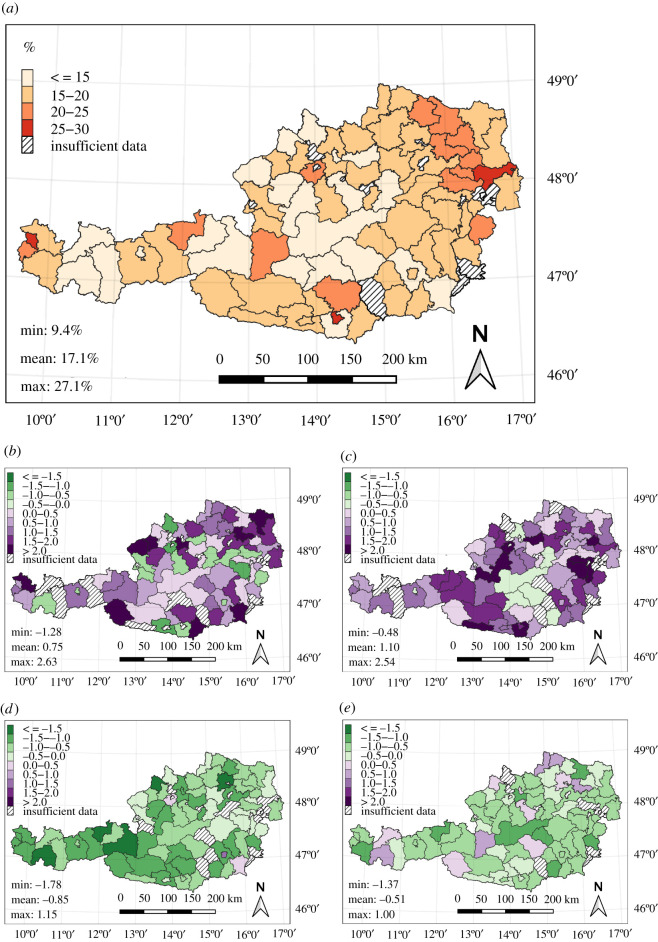
Figure 2.
Honey bee colony winter mortality rates in Austria. (a) Mean mortality rates per district over the study period 2011–2020. Only districts with at least 5 years of valid data are included (compare electronic supplementary material, figure S.2). (b–e) Differences of district mortality rates from the mean shown in (a), expressed as standard deviations. The selected years are 2012 (b), 2015 (c), 2016 (d) and 2018 (e). Green shades mark districts with lower mortality rates than on average, purple colours mark districts with higher mortality rates compared to the mean. Only districts with at least 5 years of valid data are included.

