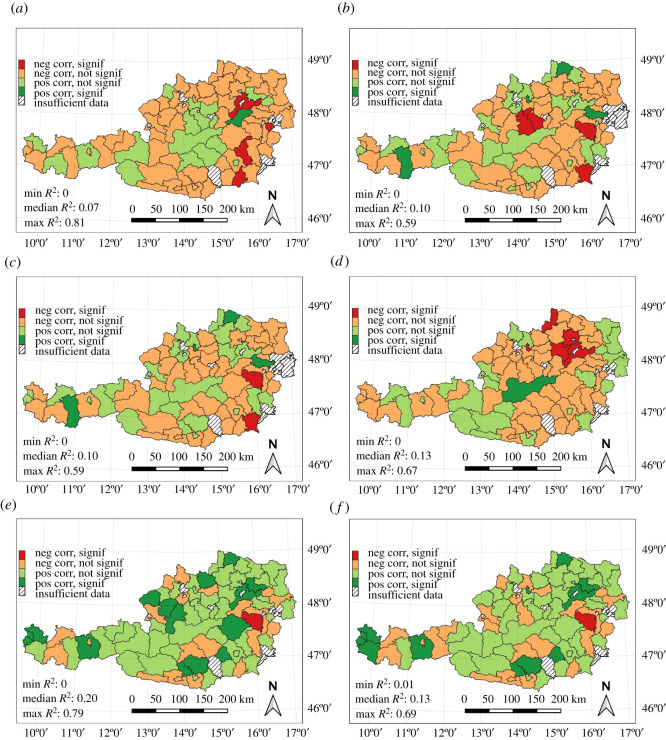
Figure 4.
Results of simple linear regression analysis for Austrian districts. Red shades show districts with negative regression coefficients; green shades show districts with a positive correlation between indicator and mortality. Darker colours indicate a statistically significant linear model (p-value < = 0.1). R2 statistics in the lower left of the figures only include districts where the correlation concurs with the respective hypothesis. (a) Days with optimal flying conditions. (b) The maximum duration of late autumn cold spells. (c) Days in late autumn cold spells. (d) Mild winter weather. (e) The maximum duration of winter cold spells. (f) Days in winter cold spells.

