Figure 5.

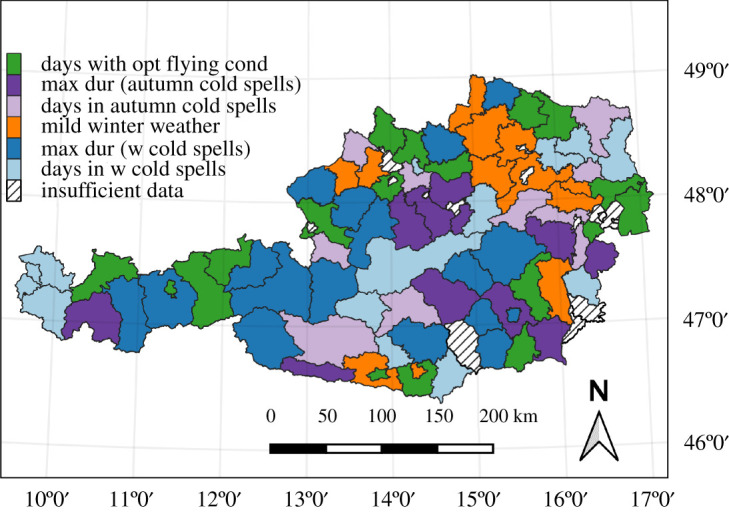
Indicator with the highest R2-value for each district. Only models matching the assumptions of the four hypotheses are included.

Indicator with the highest R2-value for each district. Only models matching the assumptions of the four hypotheses are included.