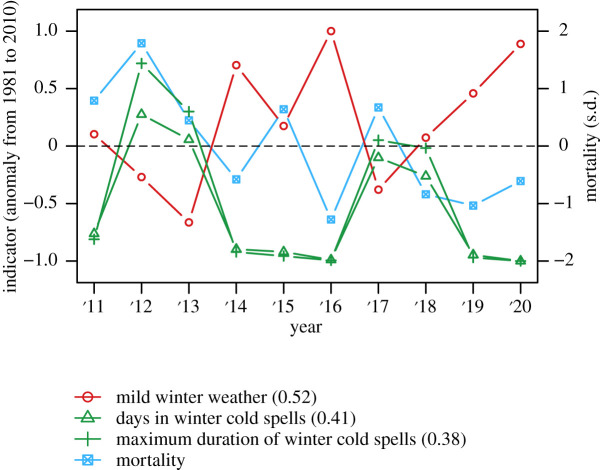
Figure 6.
Time series of mortality rates (standard deviations) and normalized indicator anomalies for the district Sankt Poelten (Land). Indicator curve colours correspond to the colour code for linear model correlation and significance presented in figure 4. Values in parentheses are R2-values from the district-level simple regression model.

