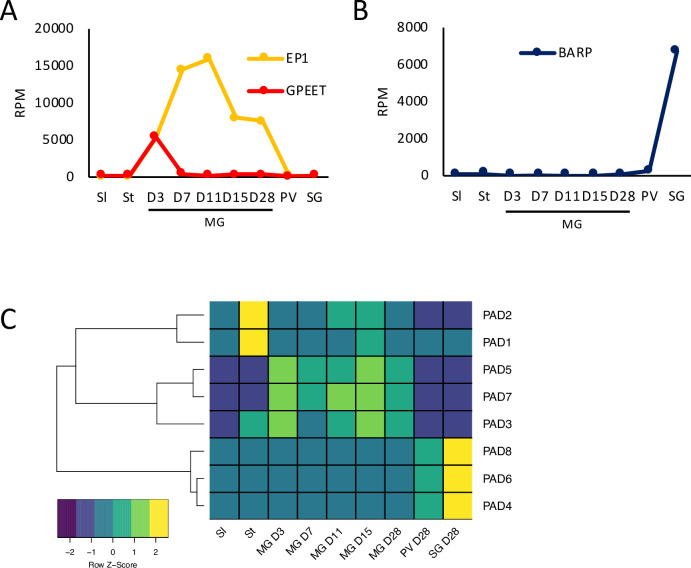
Fig 2. Expression profiles of known stage-specific markers as a function of time and tissue.
Values are the mean of three biological replicates. A) EP and GPEET procyclin; B) BARP gene family; C) Heatmap of proteins associated with differentiation (PADs 1–8). Data for slender and stumpy forms are from [10]. Sl: slender forms; St: stumpy forms; MG: midgut; PV: proventriculus, SG: salivary glands. RPM: reads per million.

