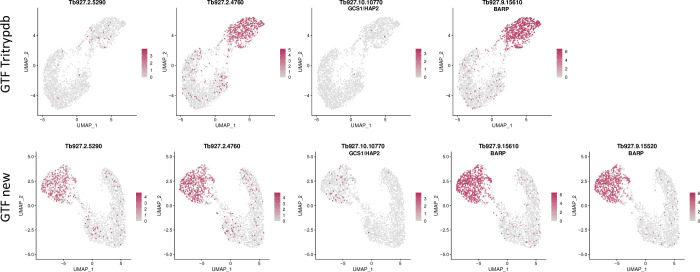
Fig 6.
UMAP coloured by transcript counts for selected genes using GTF files from TriTrypDB (upper panel) and this study (GTF new, lower panel). The scRNA-seq dataset was obtained from Vigneron et al. [41]. The colour scale shows raw transcript counts per cell. The epimastigote cluster is identified by the presence of BARP transcripts. Different BARP isoforms are expressed to different extents. Tb927.9.15620 was not identified with the GTF file from TritrypDB.

