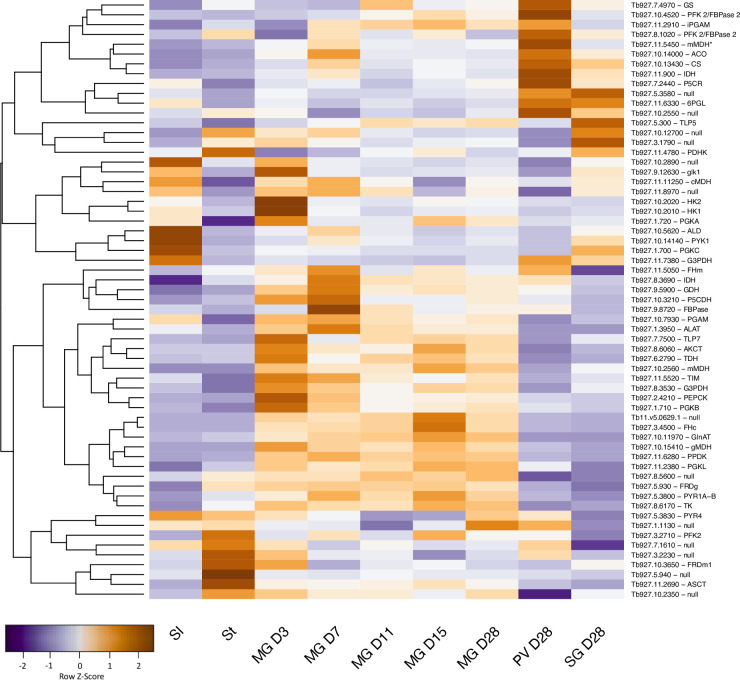
Fig 9. Gene expression heatmap of selected metabolic enzymes.
Rows indicate each gene and columns indicate samples. Data were z-score normalised. Colour scale: orange, high expression; blue, low expression. Gene IDs and names are shown. TritrydDB uses the gene name “null” for some genes with putative functions that have not been confirmed experimentally.

