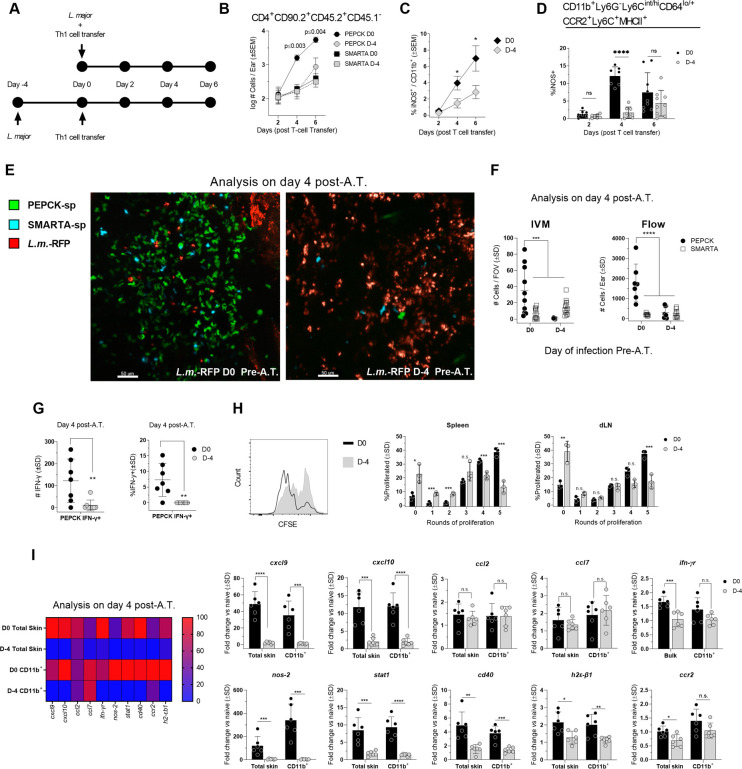
Fig 6. Delayed availability abrogates the accumulation and activation of Th1EFF cells at the dermal site of challenge.
(A) The indicated CD4+ Th1 cell populations were adoptively co-transferred into mice infected in the ear dermis with L. major just prior to (d0) or 4 days (D-4) prior to transfer and the immune response in the dermis was analyzed at an equivalent number of days post-transfer. (B) Absolute number of the specified T cell populations per ear on days 2, 4, and 6 post A.T.. 2-3x10⁶ GFP+PEPCK-specific Th1 T cells and 2-3x10⁶ SMARTA Th1 T cells (C) Frequency of iNOS+ cells within the total CD11b+ population. (D) Frequency of iNOS+ cells within the CD11b+Ly6G-Ly6Cint/hiCD64lo/+CCR2+Ly6C+MHCII+ inflammatory monocyte population (see S6 Fig for other inflammatory monocyte populations). (E) Mice were challenged with L. major and adoptively co-transferred with 2.5-3x10⁶ CellTracker CFDA-labelled GFP+PEPCK-specific Th1 T cells and 2.5-3x10⁶ CellTracker Deep Red-labelled SMARTA Th1 T cells either immediately or at day 4 p.i.. Mouse ear dermis was imaged employing confocal intravital microscopy 4 days after T cell transfer.(F) Analysis of the number of T cells/field of view (FOV) (left panel) or the total number of T cells (right panel) 4 days after T cell transfer. (G) Analysis of the number of IFN-γ+ and frequency of IFN-γ+ Th1 PEPCK—specific CD4+ T cells at day 4 post-A.T. in the dermal site of challenge. (H) Mice were infected with 2 x 10⁵ L. major and adoptively transferred with ~3x10⁶ Na PEPCK-specific GFP+ T cells immediately or 4 days p.i.. Representative histograms of proliferation dye labelled PEPCK T cells and the % of cells within the indicated proliferation peak was analyzed on day 6 post-transfer in the spleen and ear dLN. (I) 4 x 10⁶ Th1 PEPCK-specific CD4+ T cells were transferred immediately or 4 days after mouse infection with 2 x 10⁵ L. major. Expression of the specified genes was assessed 4 days after T cell transfer with qRT-PCR and normalized against no-transfer L. major infected controls. n = 6–9 total mice/group pooled from 2 independent experiments except (F, left panel) in which n = 10 FOV were analyzed and data is representative of 2 independent experiments and (H) in which n = 3 and a single experiment representative of 3 experiments is shown. Statistical analysis was performed using Student’s t-tests, one-way ANOVA, or two-way ANOVA.

