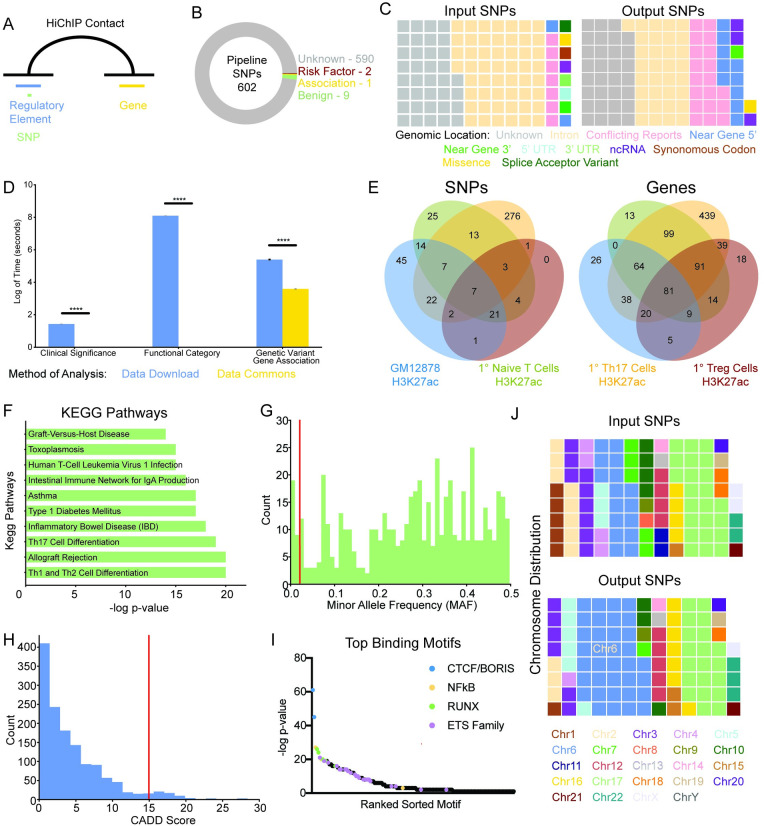
Fig 3. Pipeline prioritizes common non-coding genetic variants that are cell type specific.
A: Overview of the pipeline that identifies genetic variants in regulatory elements of interest distally connected to genes via the three-dimensional chromatin conformation. B: Clinical significance of pipeline output genetic variants. C: Functional category of input and output genetic variants. D: The amount of time to run clinical significance, functional category, and significant gene association analyses using local data scientist approach involving data download (blue) or Data Commons (gold). **** p < 0.0001. E: Venn diagram of the overlap in genetic variants (left panel) and genes (right panel) identified by the pipeline using H3K27ac HiChIP and ATAC-seq datasets from GM12878 cells (green) and primary Naïve T (green), Th17 (gold), and Treg (burgundy) cells as input. F: KEGG pathways associated with the target genes of pipeline genetic variants. G: Histogram of the minor allele frequency of the pipeline genetic variants. Red line at 0.02 indicates common cutoff for uncommon genetic variants. H: Histogram of pipeline genetic variants CADD score with red line at a score of 15 indicating a common cutoff for deleterious variants. I: Scatter plot of the top binding motifs of pipeline identified regulatory elements. J: The chromosomal location of input and output genetic variants. Input SNPs refers to the original candidate list of 12,974 genetic variants that were reported significantly associated with T1D in the GWAS catalog or are in linkage disequilibrium. The Output SNPs refers to the 602 genetic variants that were identified as candidates by the pipeline.

