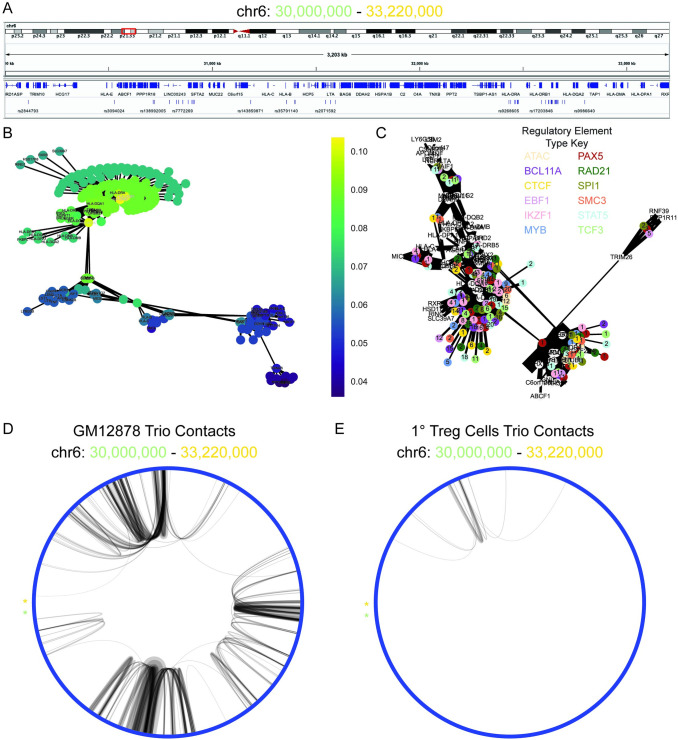
Fig 4. HLA-DRB1 and HLA-DRQ1 are top pipeline identified candidates for T1D-associated genes in the HLA locus.
A: Visualization of the HLA component of interconnected pipeline genetic variant–regulatory element–gene trios (chr6: 30,000,000–33,220,000). B: Bipartite graph of the HLA component with gene and genetic variants as nodes and chromatin connections as edges. Node color indicates closeness centrality score with gold being most connected and purple being least connected nodes in the graph. Gene nodes are labeled, and genetic variant nodes are unlabeled. C: Bipartite graph of HLA component with gene and regulatory elements as nodes and chromatin connects as edges. Gene nodes are labeled and white. Regulatory element nodes are colored by type and labeled by the number of unique genetic variants contained in the regulatory element. The width of edges indicates connectivity strength as indicated by the number of unique HiChIP reads. D: Circos plot of the chromatin connectivity at 5 kb resolution in the HLA locus. The nodes are sections of the genome and the edges are the chromatin connectivity with the width indicating connectivity strength. An asterisk labels the starting (chr6: 30,000,000; green) and terminating (chr6: 33,220,000; gold) nodes of the plot. GM12878 (left panel) and Treg (right panel) pipeline trio contacts are visualized.

