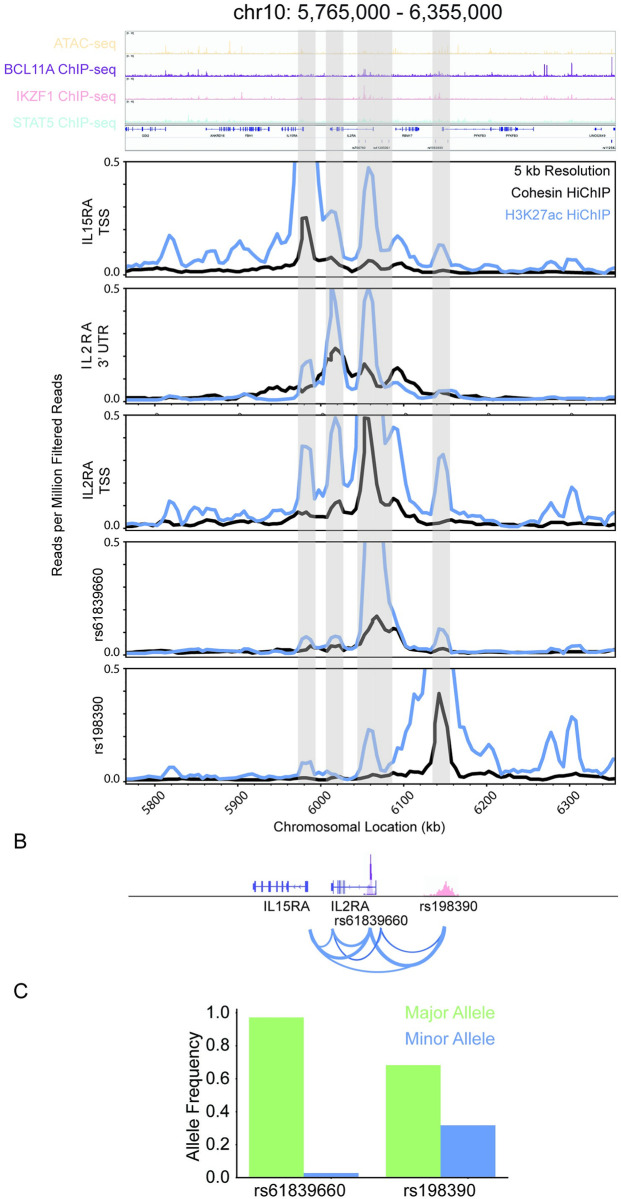
Fig 7. rs61839660 identified as a candidate for gene expression regulation of IL2RA and IL15RA.
A: Visualization of the portion of the IL2RA gene regulatory network (chr10: 5,765,000–6,355,000). ATAC-seq and BCL11A, IKZF1, and STAT5 ChIP-seq raw read visualization (top panel). Cohesin (black) and H3K27ac (blue) HiChIP raw reads virtual 4C plots centered on the IL15RA TSS, IL2RA 3’ UTR, IL2RA TSS, rs61839660, and rs198390 (bottom panel). B: Schematic of the chromatin connectivity between the genetic variants and the genes as represented by the raw data for chr10: 5,765,000–6,355,000. C: Major (green) and minor (blue) allele frequencies from 1000 Genome Project for rs61839660, and rs1983900.

