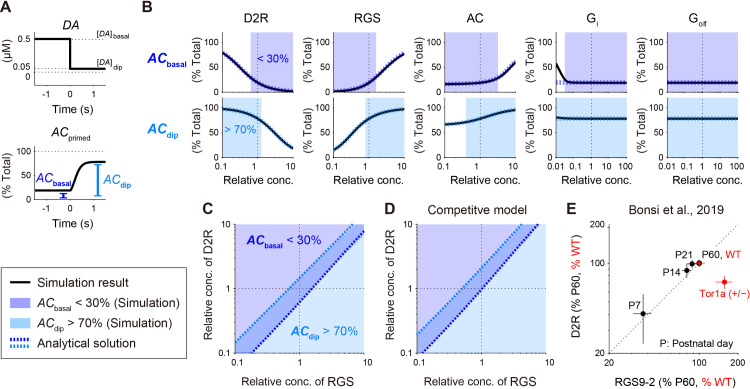
Fig 3. DA-dip detectable region appears between two increasing boundaries in the space of D2R and RGS.
(A) Introduction of two measures, ACbasal and ACdip, to quantify DA-dip detectability. ACprimed under the basal DA signal, ACbasal, should be low, whereas that during a DA dip, ACdip, should be high. (B) Concentration requirements for the DA-dip detection under the two measures. While D2R, RGS, AC, Gi, and Golf are targeted, ACbasal and ACdip are measured under the altered concentrations of one of the target molecules. Simulation results (black solid lines) and analytical solutions (blue and light blue dotted lines, Eq (23)) are plotted. ACbasal < 30% and ACdip > 70% are highlighted as the regions necessary for DA-dip detection. (C) ACbasal < 30% and ACdip > 70% in the space of [D2R]tot and [RGS]tot. Analytical isolines of ACbasal = 30% and ACdip = 70% are overlaid. (D) Same as panel C, but the D2 model is based on the competitive binding between Golf and Gi (See S2 Fig). (E) Age-dependent expression levels of RGS9–2 and D2R proteins (black points) and their altered levels in a mouse model of DYT1 dystonia (Tor1a (+/−), red points) in Bonsi et al. [28]. Data are taken from the DRM fraction of the mouse striatum (Figs 1A and 2C of Bonsi et al. [28]; modified under Creative Commons Attribution 3.0). P7,…, P60 denote mouse postnatal days. Data are normalized by the expression levels in P60 or wild type (WT).

