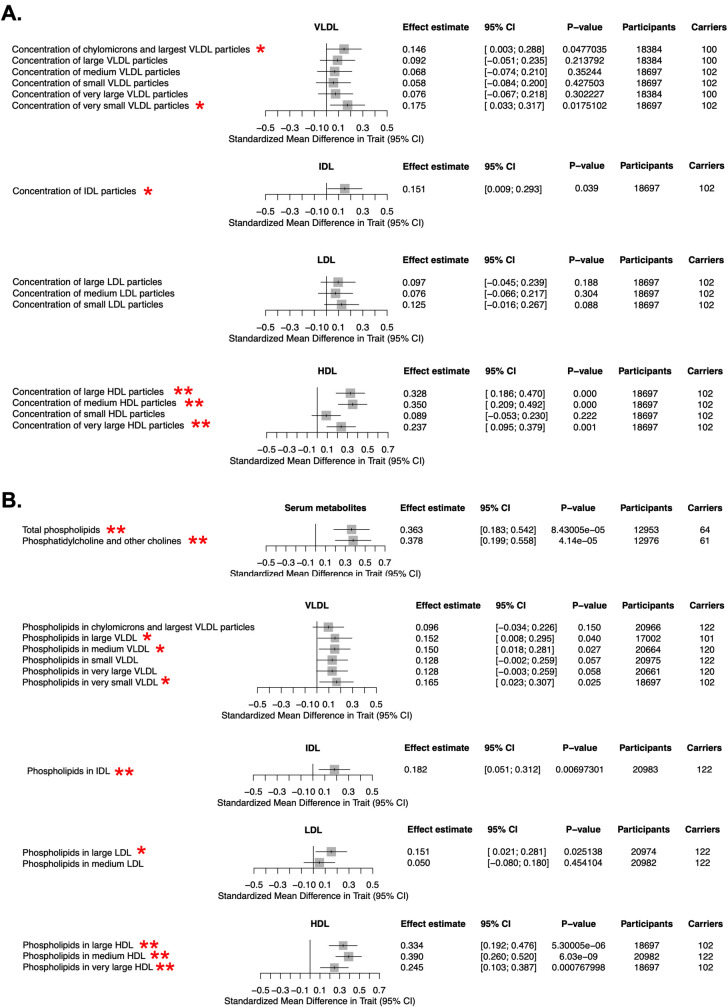
Fig 2. Association of LIPG p.Asn396Ser variant with serum lipoprotein and lipid metabolites by NMR.
A. Association of LIPG p.Asn396Ser variant with lipoprotein subclass concentrations measured through NMR spectroscopy from human serum from a European cohort comprising up to 24,925 individuals as described previously [31] (see Materials and Methods). B. association of LIPG p.Asn396Ser variant with phospholipid concentrations in serum and in lipoprotein subclasses from analysis in (A). Effect estimates for each log-transformed lipid trait in standard deviation (S.D.) units and 95% confidence intervals are plotted. Single red star (*) indicates measures with nominally significant associations between LIPG p.Asn396Ser carriers and noncarrier controls (P<0.05); double red star (**) indicates measures with experiment-wide significant differences between carriers and controls (FDR < 0.05).

