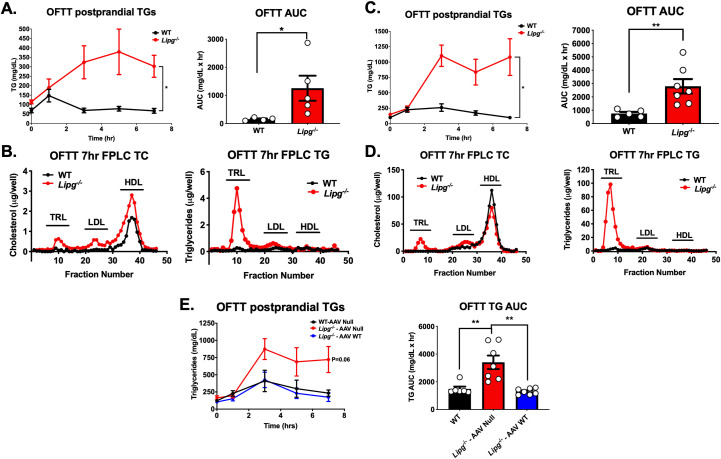
Fig 4. Postprandial chylomicron clearance in Lipg-deficient mice.
A. Plasma triglycerides (left) and area under the triglyceride clearance curves (right) in EL WT vs. Lipg-/- mice fed a regular chow diet after overnight fasting and oral fat tolerance testing with olive oil gavage. B. Cholesterol and triglycerides from FPLC fractions of pooled plasma from the 7 hour timepoint from the olive oil gavage in A. C. Plasma triglycerides (left) and area under the triglyceride clearance curves (right) in EL WT vs. Lipg-/- mice fed a high fat diet for 12 weeks after overnight fasting and oral fat tolerance testing with olive oil gavage. D. Cholesterol and triglycerides from FPLC fractions of pooled plasma from the 7-hour timepoint from the olive oil gavage in (C). E. Plasma TGs (left) and areas under the curve (right) after olive oil gavage in EL WT mice treated with Null adeno-associated virus vector (WT-AAV Null), Lipg-/- mice treated with Null vector (Lipg-/—AAV Null), or Lipg-/- mice treated with AAV expressing murine Lipg directed to the liver (Lipg-/—AAV WT). A left, C left, E left: P<0.05, repeated factor 2-way ANOVA, A right, C right, E right: *P<0.05, **P<0.01, student’s unpaired T-test. Data is expressed as mean ± S.E.M.

