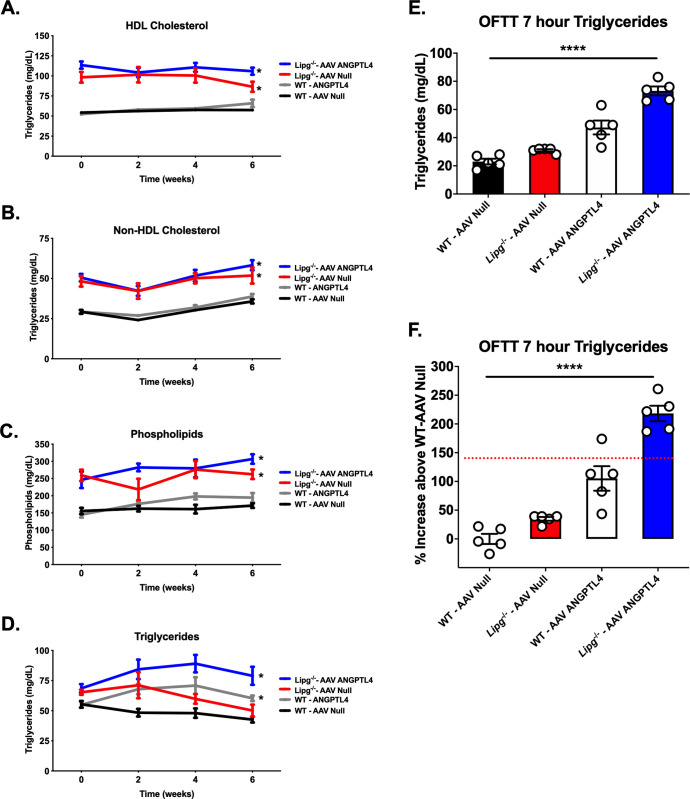
Fig 7. Impact of LPL inhibition with ANGPTL4 overexpression in Lipg-/- mice.
A-D. Plasma HDL-C, nonHDL-C, phospholipids, and TGs from WT vs. Lipg-/- mice treated with AAV Null vector (WT-AAV Null; Lipg-/-—AAV Null) or AAV ANGPTL4 vector (WT-AAV ANGPTL4; Lipg-/-—AAV ANGPTL4) after a 4 hour fast. Lipids were measured by chemical autoanalyzer. E-F. Plasma TGs 7 hours after oral fat tolerance testing in mice from (A). TGs in mg/dl are shown in (E). The relative difference in percent (%) increase above the WT–AAV Null group in plasma TGs from each group in (E) is shown in (F). In (F) the red dotted line shows the mean summed % increase in 7 hour plasma TGs for the Lipg-/-—AAV Null and the WT-AAV ANGPTL4 group. For A-D, *P<0.05, **P<0.01, ***P<0.001, two-way ANOVA comparing the indicated groups to the WT AAV-Null group. For E and F, ****P<0.0001, two-way ANOVA across groups comparing interaction of genotype (WT vs Lipg-/-) and AAV (Null vs ANGPTL4). All error bars indicate mean ± S.E.M.

