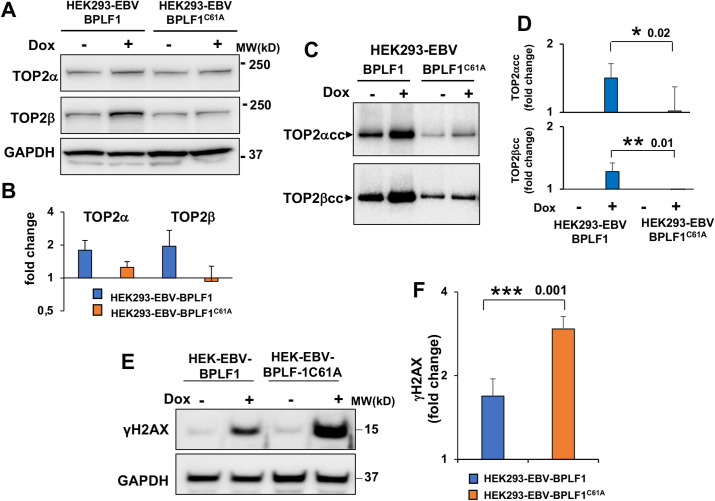
Fig 5. BPLF1 regulates the activity of TOP2 in productively infected HEK293-EBV cells.
The productive virus cycle was induced by treatment with 1.5 μg/ml Dox in HEK293-EBV cells carrying recombinant EBV encoding wild type or catalytic mutant BPLF1 and a tetracycline regulated BZLF1 transactivator. The expression of TOP2α and TOP2β was assessed by western blot and the intensity of the specific bands was quantified using the ImageJ software. (A) Representative western blots illustrating the small upregulation of TOP2α and TOP2β in cells expressing catalytically active BPLF1. (B) Densitometry quantification of the specific bands was performed using the ImageJ software and the values were normalized to the GAPDH loading control. The mean ± SD of three independent experiments are shown. (C) Representative RADAR assay illustrating the accumulation of TOP2α and TOP2β cleavage complexes in cells expressing catalytically active BPLF1. Western blots from one representative experiment out of three are shown. (D) The intensity of the DNA trapped TOP2α and TOP2β species was quantified using the ImageJ software. The mean ± SD fold increase in induced versus non induced cells recorded in three independent experiments is shown. Statistical analysis was performed using Student’s t-test. *P≤0.05; **P≤0.01. (E) Representative western blot illustrating the expression of the DDR marker γH2AX in induced HEK293-EBV cells expressing catalytic active or inactive BPLF1. (F) The intensity of γH2AX bands were quantified by densitometry in three independent experiments. The fold increase in induced versus control cells was calculated after normalization to the GAPDH loading control. Statistical analysis was performed using Student’s t-test. ***P≤0.001.

