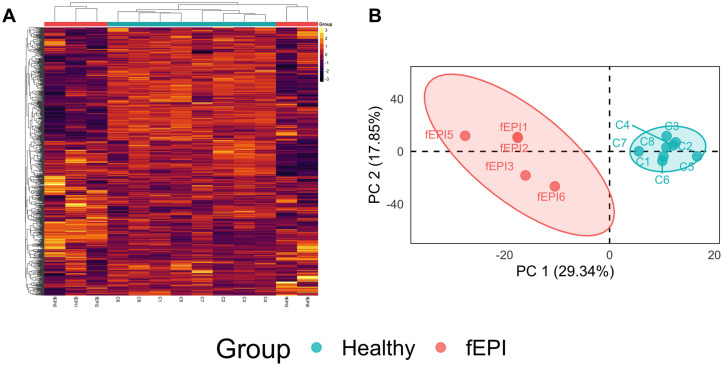
Fig 1. Unsupervised analysis of serum metabolite profiles.
A. A statistical heatmap of metabolite abundance and clustering dendrogram of samples based on their Euclidian distances revealed separation of cats with EPI from healthy controls. The color of each cell is proportional to the z-scaled abundance of each metabolite. B. PCA separates samples from cats with EPI from healthy controls along the first principal component. The colored ellipse surrounding each cluster of samples represents the 95% confidence interval.

