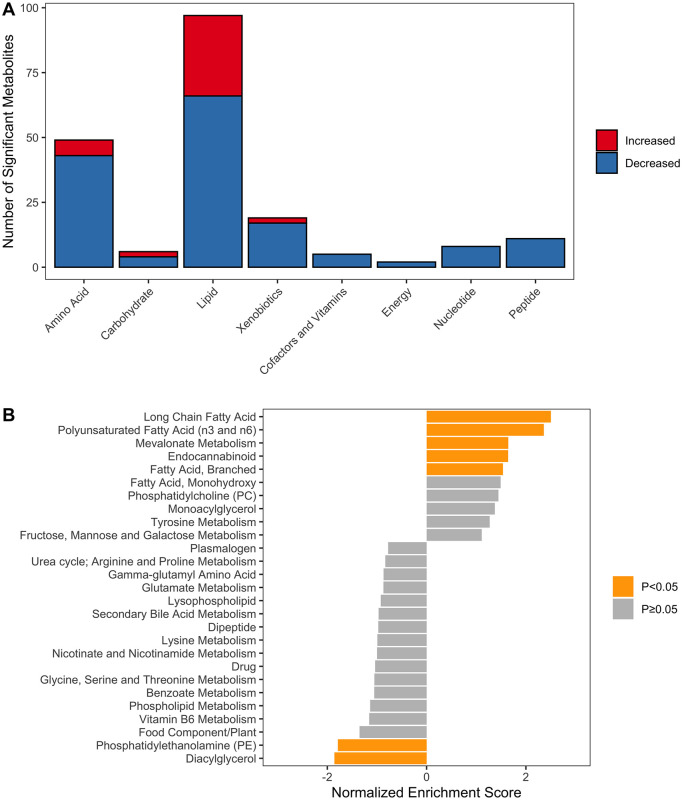
Fig 2. Metabolite set enrichment analysis.
A. Representation of metabolic super pathways among metabolites that varied significantly between the EPI and healthy control groups. B. Metabolite set enrichment analysis (MSEA) was used to detect significantly enriched metabolic sub-pathways in cats with EPI. The normalized enrichment score (NES) represents the degree to which a metabolic sub-pathway is over-represented at the top or bottom the list of ranked metabolites. A positive NES means that a metabolic sub-pathway is up-regulated in EPI and a negative NES means that it is down-regulated. The color of the bar representing NES is orange for significantly altered pathways (P<0.05) and grey for those that were not significantly altered (P≥0.05).

