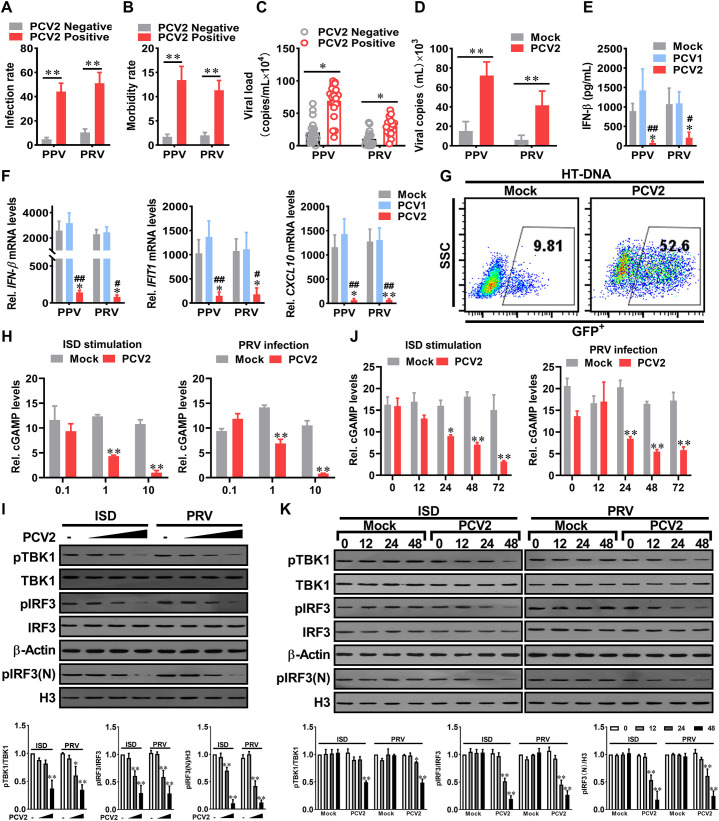
Fig 1. PCV2 inhibits the activation of type I IFN signaling to facilitates the infection of other DNA viruses by reducing cGAMP production.
(A, B) The infection rate and morbidity of porcine parvovirus (PPV) or porcine pseudorabies virus (PRV) were compared between PCV2 positive pigs and PCV2 negative pigs. The native pig herds (n = 452) were separated into PCV2 positive group (n = 271) and PCV2 negative group (n = 181), then the infection rates (A) and the morbidity rates (B) of PPV or PRV were further analyzed in these two groups. (C) The PPV and PRV loads in native PCV2 positive pigs are higher than that in native PCV2 negative pigs. The viral copy numbers of PPV and PRV in the serum of native PCV2 positive pigs (n = 20 per group) and native PCV2 negative pigs (n = 17 per group) were measured by qPCR. * P < 0.05, ** P < 0.01 (compared with PCV2 negative pigs). (D) PPV and PRV replication levels in PCV2-infected cells are higher than that in mock infection cells. The PK-15 cells were infected with mock or PCV2 for 48 h, then were further infected with PPV or PRV, and the relative viral titers were measured by TCID50. * P < 0.05, ** P < 0.01(compared with mock infection). (E, F) PCV2 inhibits PPV- or PRV-induced IFN-β production and response. The piglets were infected by PCV1 (4×10⁵ TCID50), PCV2 (4×10⁵ TCID50), or mock (same volume of medium) for 1 week, respectively, and then challenged with 105 TCID50 PPV or 105 TCID50 PRV for another 24 h. The serum IFN-β of the infected piglets were measured by ELISA (E); IFN-β, IFIT1, and CXCL10 mRNA levels in lung tissues were determined by qPCR (F). * P < 0.05, ** P < 0.01 (compared with mock infection); # P < 0.05, ## P < 0.01 (compared with PCV1 infection). (G) Comparison of VSV-GFP replication in PK-15 cells pretreated with the cell supernatants from HT-DNA-stimulated mock-infected cells or HT-DNA-stimulated PCV2-infected cells. GFP positive cells were measured by flow cytometry. (H-K) PK-15 cells were infected with different doses (0.1, 1, 10 MOI) of PCV2 for 24 h (H, I), or infected with PCV2 (MOI = 1) for the indicated time (J, K), and then the relative cGAMP production levels (H, J), the levels of p-TBK1, p-IRF3, and nucleoprotein pIRF3 (pIRF3(N)) at 6 h following ISD stimulation or PRV infection were determined by report assay and western blotting, respectively. * P < 0.05, ** P < 0.01(compared with mock infection).

