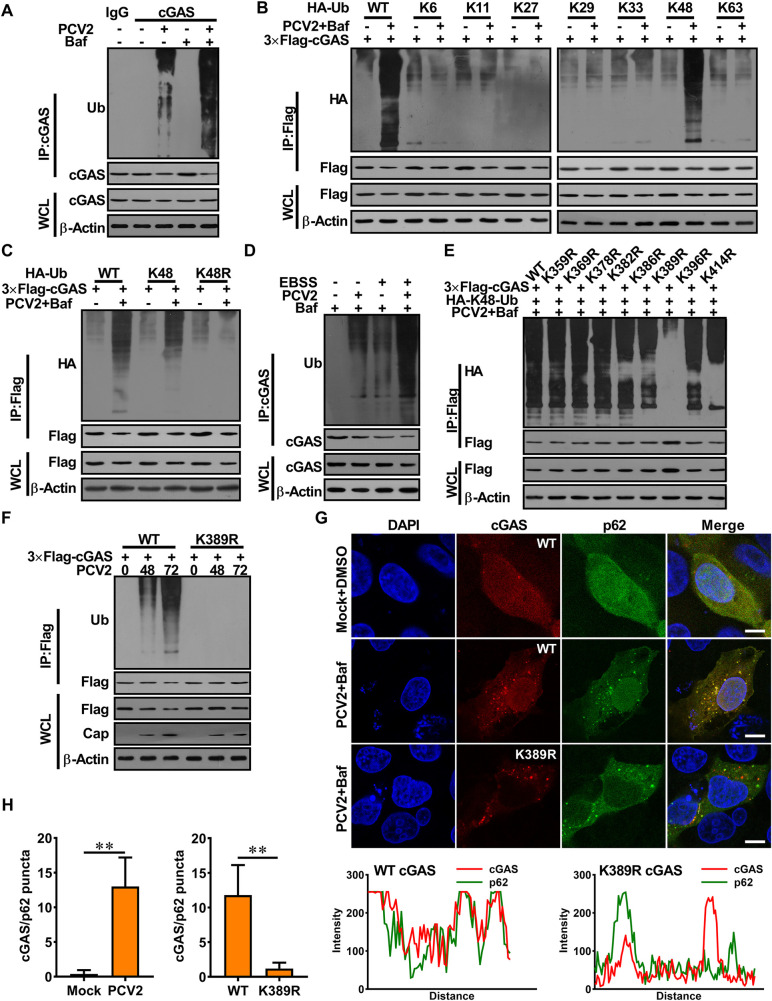
Fig 3. PCV2 infection enhances the K48-linked poly-ubiquitination of porcine cGAS at K389 and facilitates the interaction of cGAS with p62 for autophagic degradation.
(A) PCV2 infection enhanced the ubiquitination of porcine cGAS. PK-15 cells were infected with PCV2 (MOI = 5) along with or without Baf for 48 h. Cell lysates were analyzed by immunoprecipitated with anti-porcine cGAS antibody, and ubiquitinated cGAS proteins were immunoblotted using anti-ubiquitin antibodies. (B, C) Porcine cGAS was mainly ubiquitinated with K48 linkage in PCV2-infected cells. PK-15 cells were transfected with different HA-Ub constructs as indicated, then infected with PCV2 in the presence or absence of Baf. Cell lysates were immunoprecipitated with anti-Flag antibody and immunoblotted with anti-HA antibody. (D) PK-15 cells were treated with EBSS together with or without PCV2 infection (MOI = 5) in the presence of BAF for 48 h. The poly-ubiquitination levels and protein levels of cGAS were analyzed. (E) The lysine 389 of porcine cGAS is required for its K48-ubiquitination induced by PCV2 infection. PK-15 cells were transfected with cGAS mutant expression vectors as indicated, then cells were infected with PCV2 (MOI = 5) in the presence of Baf for 48 h, the poly-ubiquitination levels of cGAS were analyzed. (F) Mutation of the lysine 389 of porcine cGAS can block poly-ubiquitination and degradation of porcine cGAS induced by PCV2. PK-15 cells were transfected with plasmids as indicated, then infected with PCV2 (MOI = 5) for the indicated time. Protein lysates were immunoprecipitated with anti-Flag antibody and immunoblotted with anti-Ub antibody. (G, H) Poly-ubiquitination of porcine cGAS at K389 is required for the interaction of cGAS with p62. The cGAS-/- PK-15 cells expressed Flag-cGAS, Flag-cGAS (K389R), then infected with Mock or PCV2 along with Baf (DMSO as a control). Cells were subjected to confocal assay to observe the co-localization of cGAS and p62. The co-localization signals of targeted proteins were analyzed as intensity profiles of indicated proteins along the plotted lines by Image J line scan analysis (G). Scale bar, 10 μm. Statistics of the puncta formation by cGAS-p62 in the indicated samples (H). ** P < 0.01 (compared with Mock or WT).

