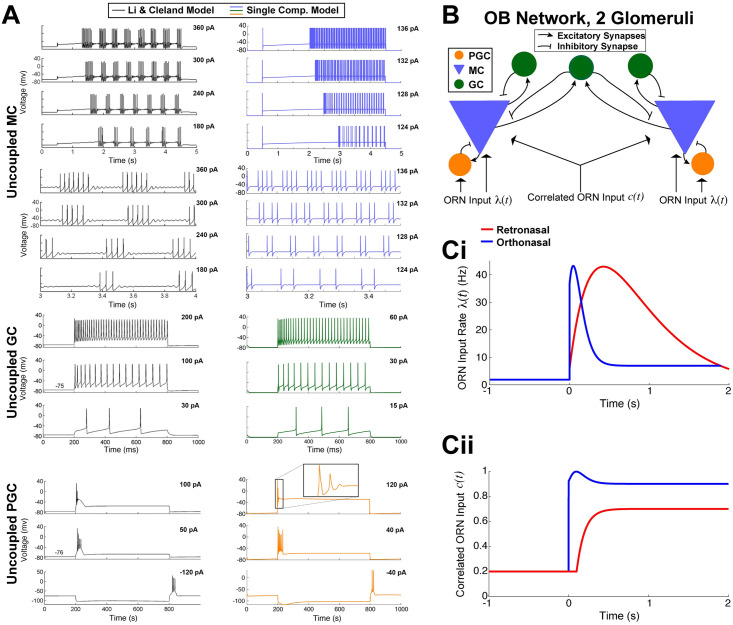
Fig 2. Biophysical OB model.
A) Dynamics of the 3 uncoupled cell models. MC voltage dynamics with current step inputs in Li & Cleland models (black curves on the left, copied from Li & Cleland [29]) are captured by our single-compartment model (blue on the right). Rows 5–8 show expanded time view of first 4 rows to highlight spike cluster sizes and sub-threshold oscillations (same voltage axis for each). GC voltage responses to three different levels of current injection in the Li & Cleland model (black curves on the left) is similar to our model (green on the right). PGC responses with depolarizing current steps again are similar in both models. Note that release from a hyperpolarizing current injection leads to transient spiking in both models (bottom). B) Coupled OB network model of 2 glomeruli with ORN inputs. ORN synapses are driven by correlated inhomogeneous Poisson Processes (Eqs (10)–(12)). C) Based on ORN imaging studies, we set λO(t) to increase and decay faster than λR(t) with odor onset at time 0s (i). Similarly, we set the input correlation of ORN synapses to the 2 MCs to cR/O(t) where cR(t) < cO(t) and cO(t) rises quicker than cR(t) (ii).

